The tools
ORA.01 · Oráculo ES
See it live

TDI / ORA.01 · decides · Where the answer becomes a deliverable

Oráculo™

Ask in Spanish; it answers with the number and where it came from.

Serebro answers standalone questions. Oráculo is where those answers become a deliverable a committee can read: the category dashboard, the study, the qualitative session, and the panel of experts that reviews the piece before it goes out to sell.

Category dashboard
size, segments, concentration, channel, shelf, and consumer
Board pack
the quarter on one page, with its risk matrix and mitigation
Shelf and distribution
who gets how much space, chain by chain and state by state
Public listening
real reviews weighted, with the arithmetic in plain sight
Segment snapshot
the portrait of your buyer —census, interest, trade, and shelf— with the grade of each data point and the list of what's missing
Qualitative · focus group
a seven-stage guide for moderating with real people, and the simulated session, labeled as such
Panel of experts
sales, media, design, and copy review the piece against the sales objective
Scenarios and alerts
the “what if…?” with numbers, and the list of things to do every week

Who it's for, and what question they bring
Executive leadership“what do I bring to the board?”
The quarter on one page, with its risk matrix. And every slide with its own “what this slide CANNOT claim” section — which is what makes it defensible when someone asks how you know.
CMO“where am I overspending?”
Shelf with the day's prices, who's running ads today in your category, and an evaluation of your own pieces against advertisers with the same objective and spend level.
Sales“who do I talk to first?”
The segment snapshot: how many there are, where they search, what's on the shelf, and who's talking to them. Starting at $45,000 and seven business days.
Insights“does this help me or get in my way?”
It's the window into the vault, not another database. Ask in Spanish, it answers with the number, its source, and the year of the data. And if it doesn't have it, it says so.
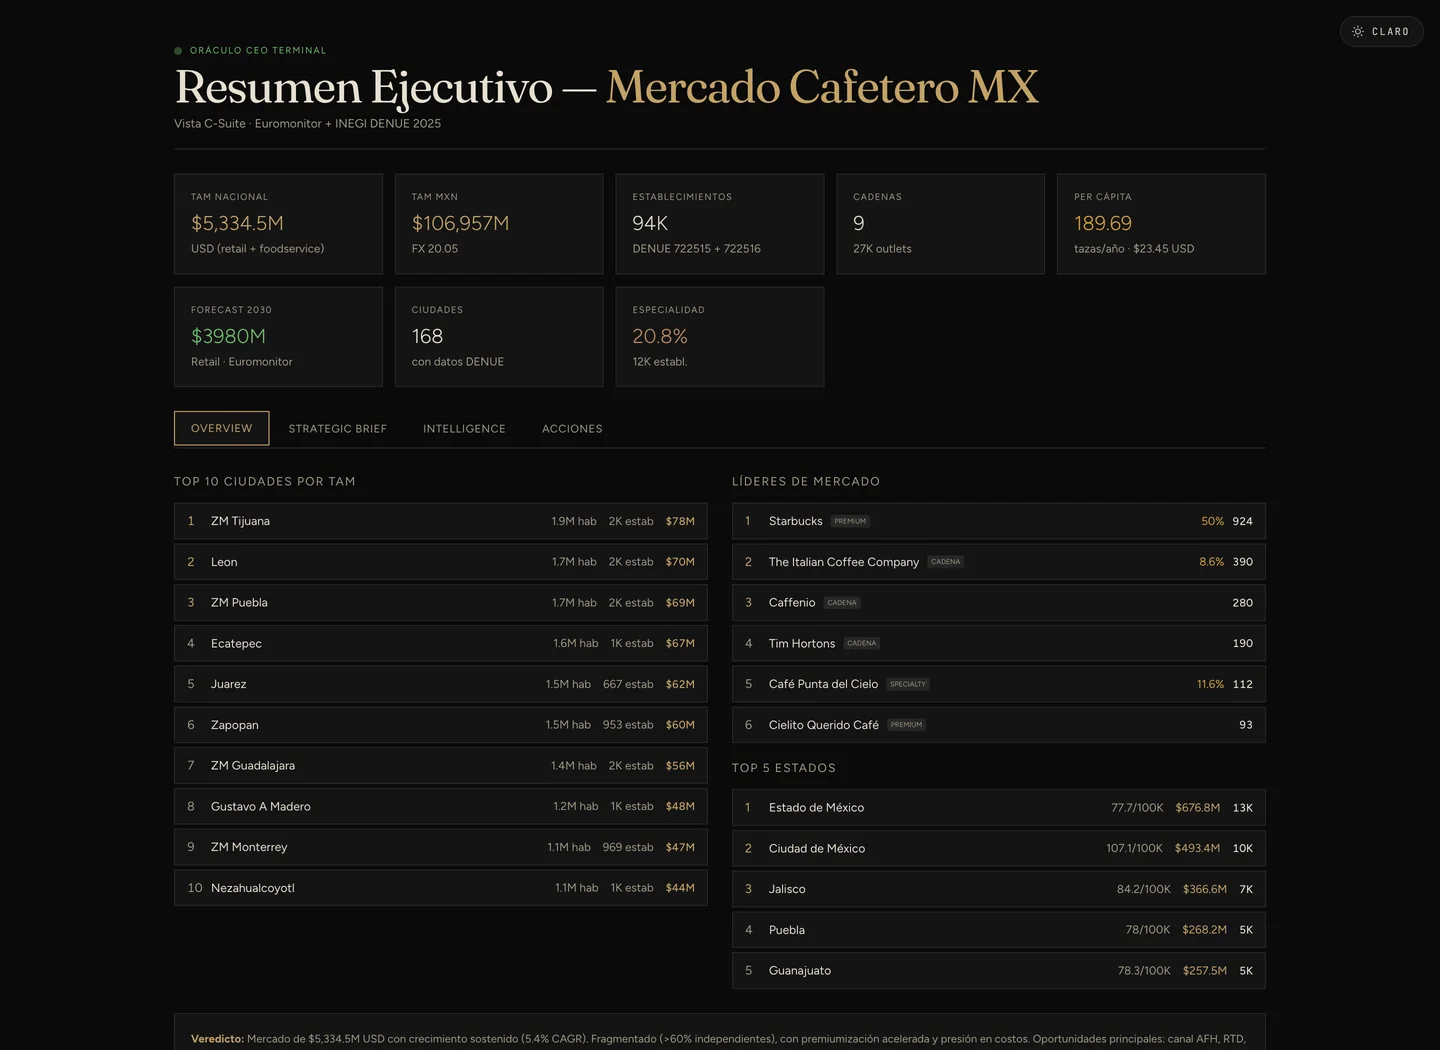
Oráculo's executive terminal for the Mexican coffee market: national TAM of USD 5,334.5 million, 94 thousand establishments, 9 chains, 189.69 cups per year, top 10 cities by TAM, and market leaders with their share.
AThe screen that goes to the committee. Coffee in Mexico: TAM of USD 5,334.5 M (retail + foodservice), 94 thousand establishments from the census, 9 chains with 27 thousand locations, 189.69 cups per person per year, 2030 forecast. On the left, the ten cities by size; on the right, who's in charge —Starbucks 50% with 924 stores, The Italian Coffee 8.6% with 390— and the five states. Below, a written verdict, not one more chart.
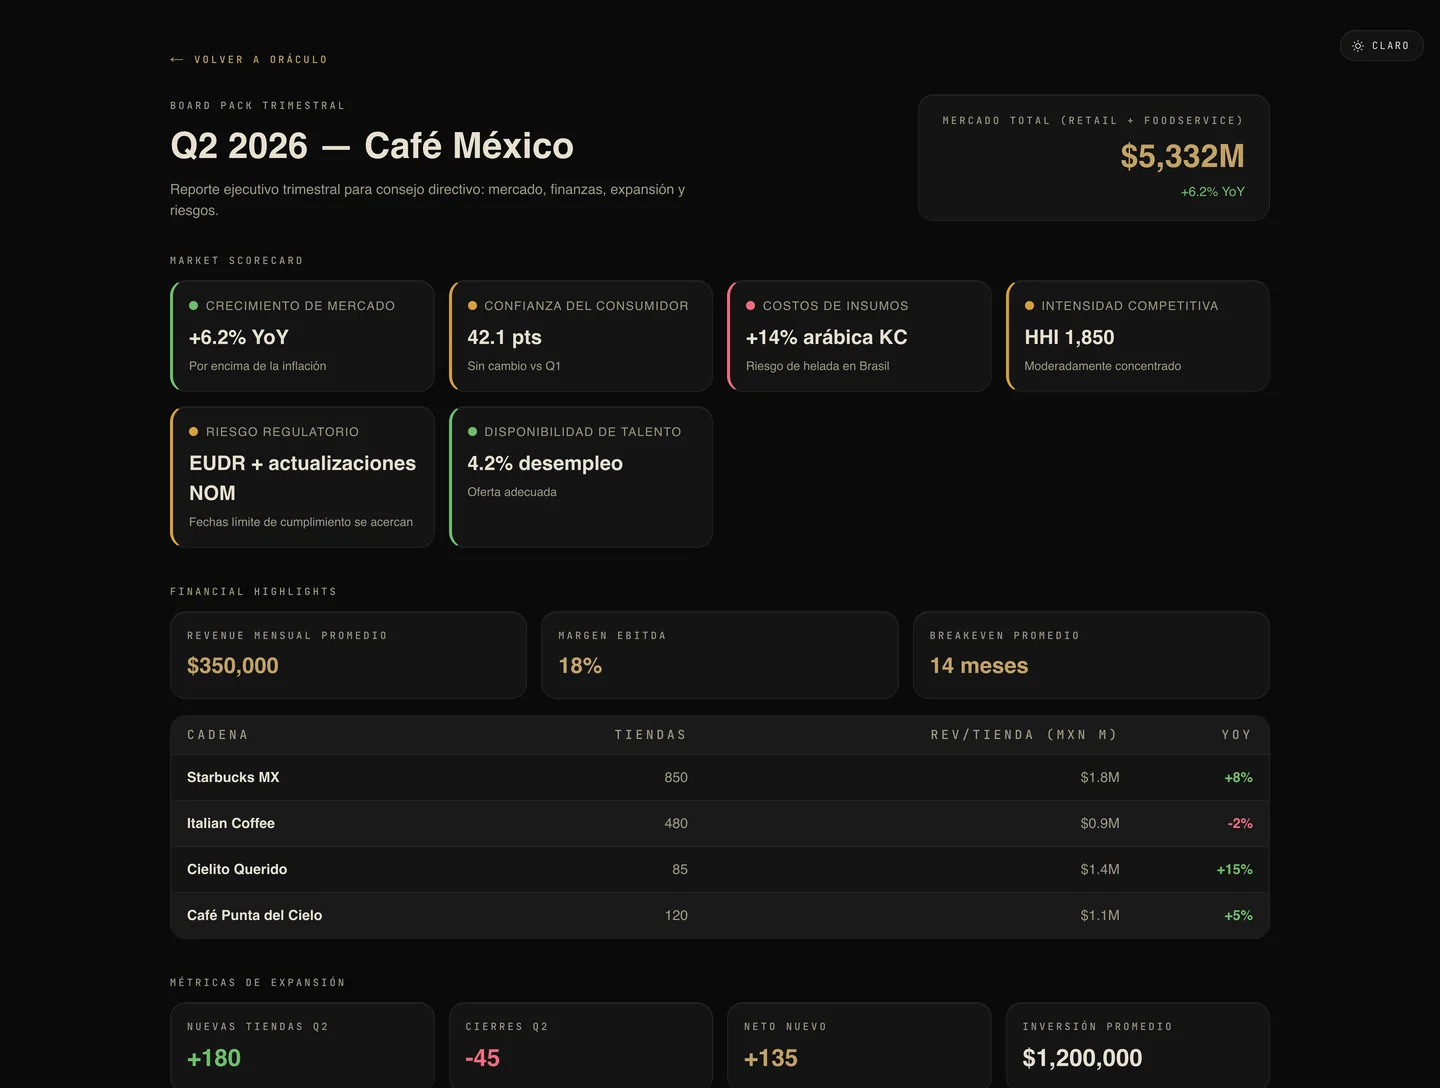
Quarterly board pack: market card deck with six indicators, financial summary, revenue per store for four chains, expansion metrics, risk matrix, and strategic recommendations.
BAnd the pack that goes to the board, already built. A quarter on one page: six market indicators with their reading —growth +6.2% against inflation, consumer confidence 42.1 points, input costs +14%, competitive intensity HHI 1,850, regulatory risk, talent availability—, the revenue per store for each chain with its change, the quarter's net expansion (+180 openings, −45 closings, +135 net) and a risk matrix with its mitigation. Nobody has to translate it into board language: it's already written that way.
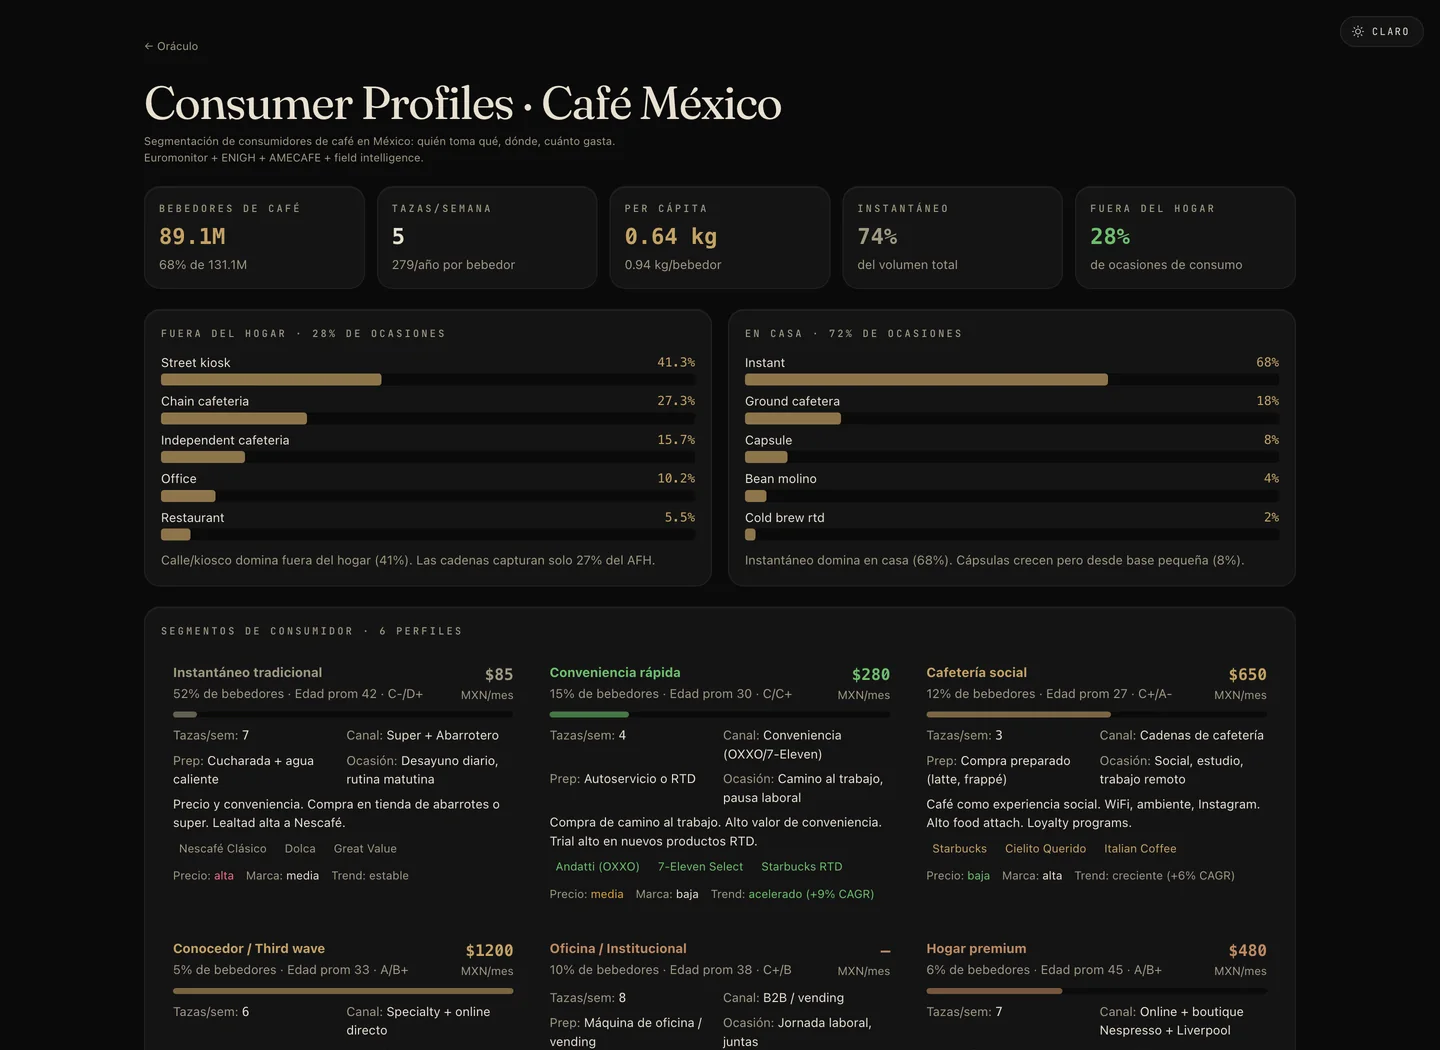
Mexican coffee consumer profiles screen: 89.1 million drinkers, 5 cups per week, the split of occasions in and out of home, and six segments with their monthly spend, channel, occasion, and brands.
CWho's buying. 89.1 M drinkers, 5 cups per week, 28% of occasions away from home — and there the street kiosk carries 41.3% against 27.3% of the chains. Below, six segments with their monthly spend: from $85 for traditional instant to $1,200 for third wave, each with its channel, its occasion, its brands and whether it competes on price or on brand. This is what a portfolio plan needs to split money between brands.
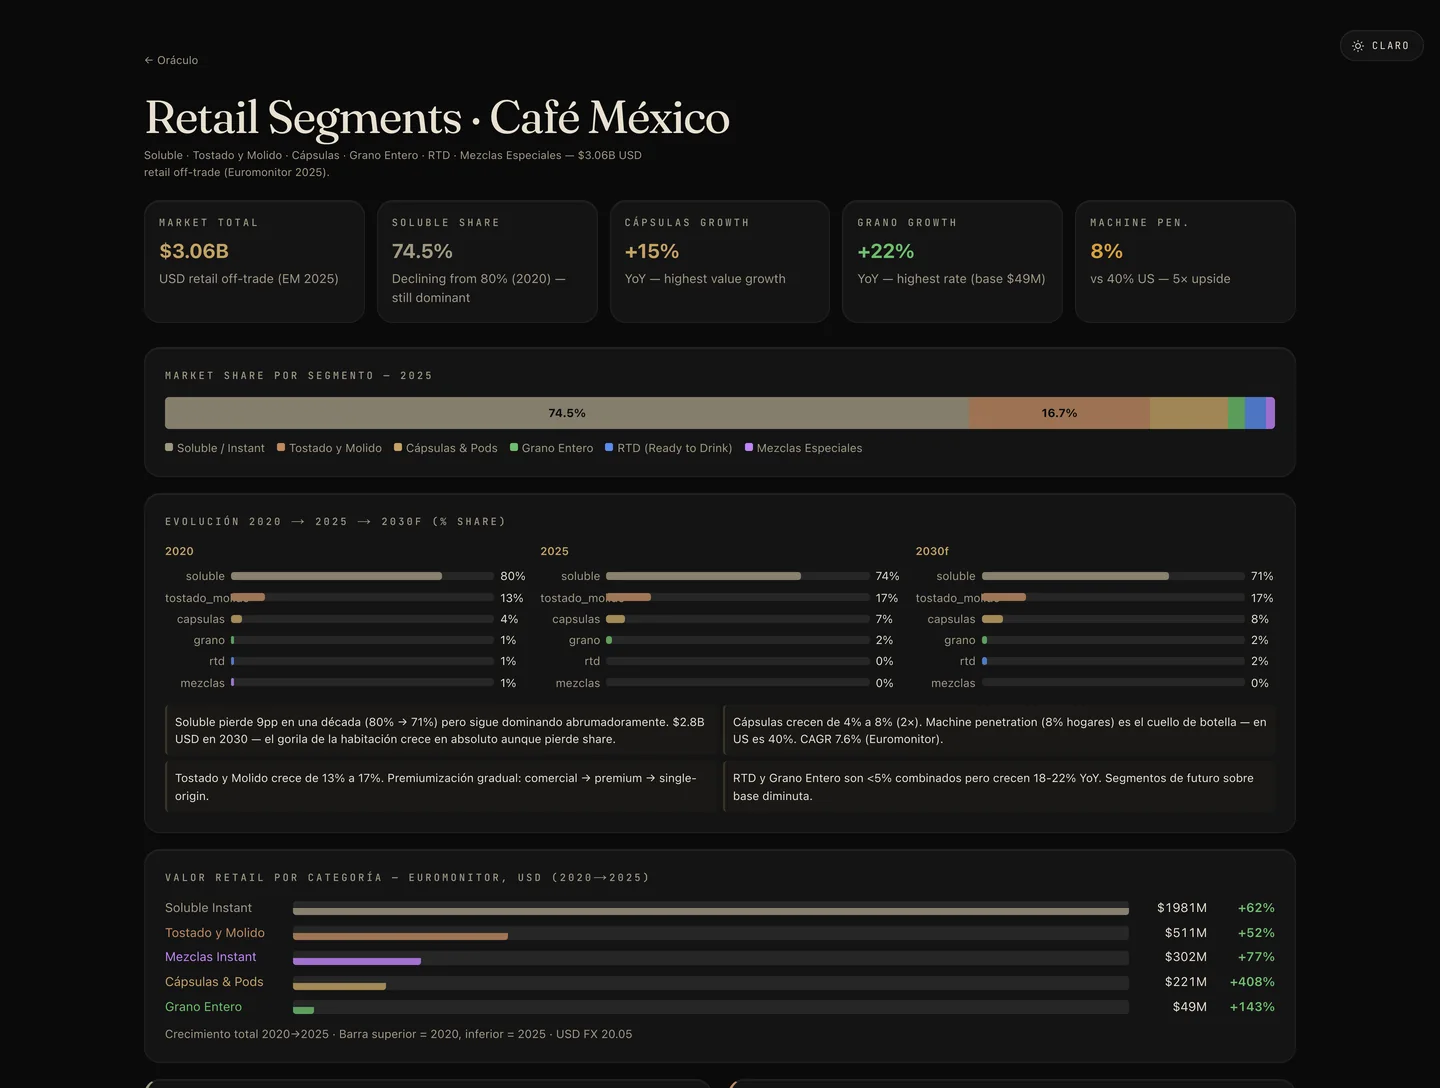
Category retail segments: six segments with their 2025 share, the 2020-to-2030 evolution, and the value of each category in dollars with its growth.
DHow the category is split, and where it's headed. Six segments over USD 3.06 B of retail. The big one falls from 80% to 74.5% and will keep falling to 71% in 2030 —but it grows in money while losing share, and the dashboard says so in those words. Capsules go from 4% to 8% and the bottleneck is named: 8% machine penetration against 40% in the United States. Below, the value of each category in 2020 against 2025: +408% in capsules, +143% in whole bean. This is how you decide which brand in the portfolio gets the money next year.
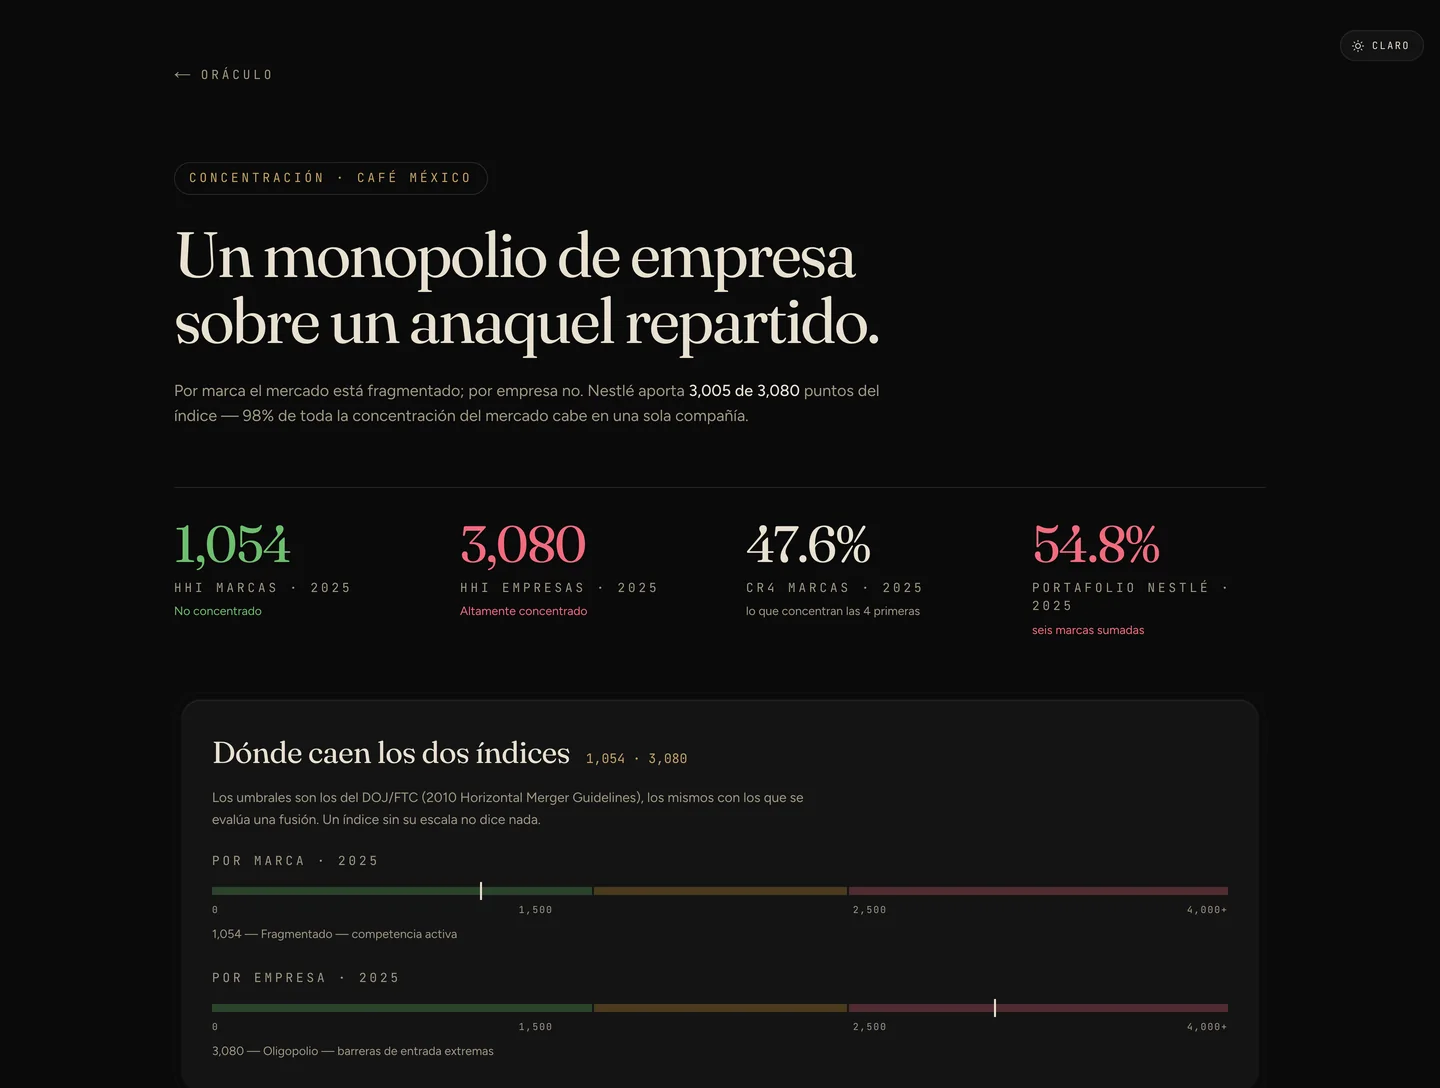
Concentration page: the brand-level index scores 1,054 and the company-level index 3,080, with both scales drawn against the official thresholds and the leader's portfolio breakdown.
EA company monopoly over a shelf that looks split. It's the headline the system wrote on its own, and it's the kind of finding worth paying for: by brand the market scores 1,054 —fragmented, active competition— and by company it scores 3,080, an oligopoly with extreme barriers. A single company contributes 3,005 of those 3,080 points: 98% of all the concentration. And both indices are drawn against the official thresholds used to evaluate a merger, because an index without its scale says nothing. Notice too the note on the axis: “starts at 53.0%, not at zero.”
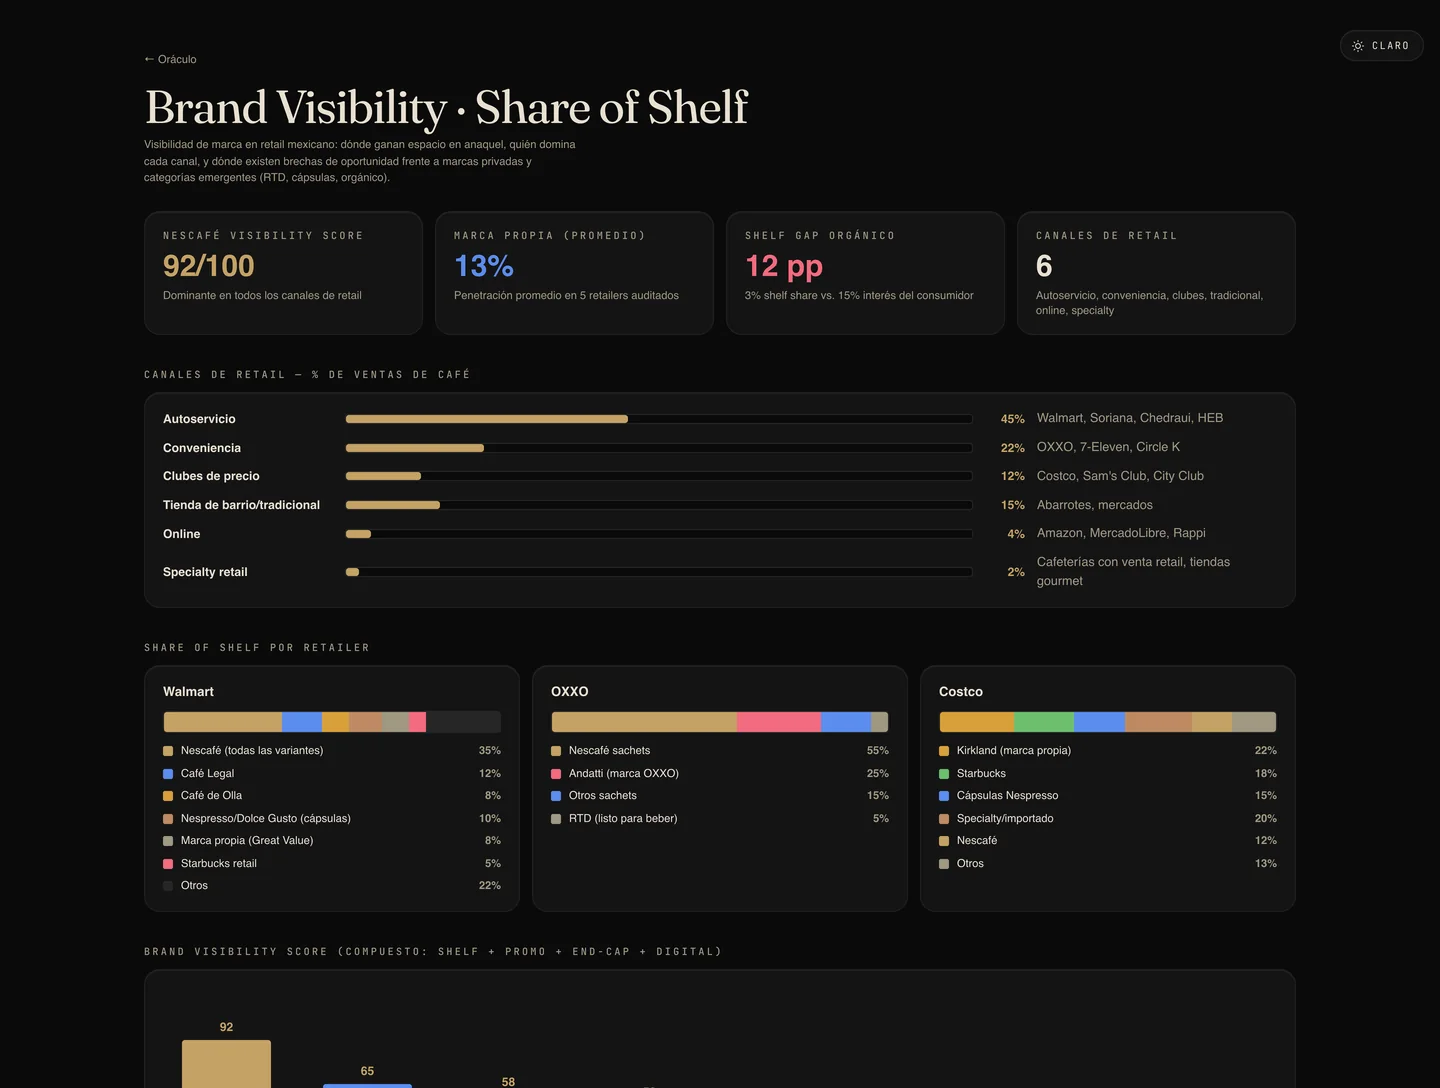
Brand visibility and shelf share: six retail channels with their weight, the shelf split within three different chains, and the composite scorecard for eight brands.
FThe shelf, chain by chain. Six channels with their real weight —supermarkets 45%, convenience 22%, clubs 12%, corner stores 15%— and within each chain who gets how much space: in one, the leader at 35%; in the convenience chain, 55% and the store's own brand at 25%; in the price club, the store brand leads with 22%. At the bottom, the composite scorecard —shelf + promotion + endcap + digital— running from 92 to 12. And a gap with a name: 3% organic shelf presence against 15% consumer interest, a 12 point gap.
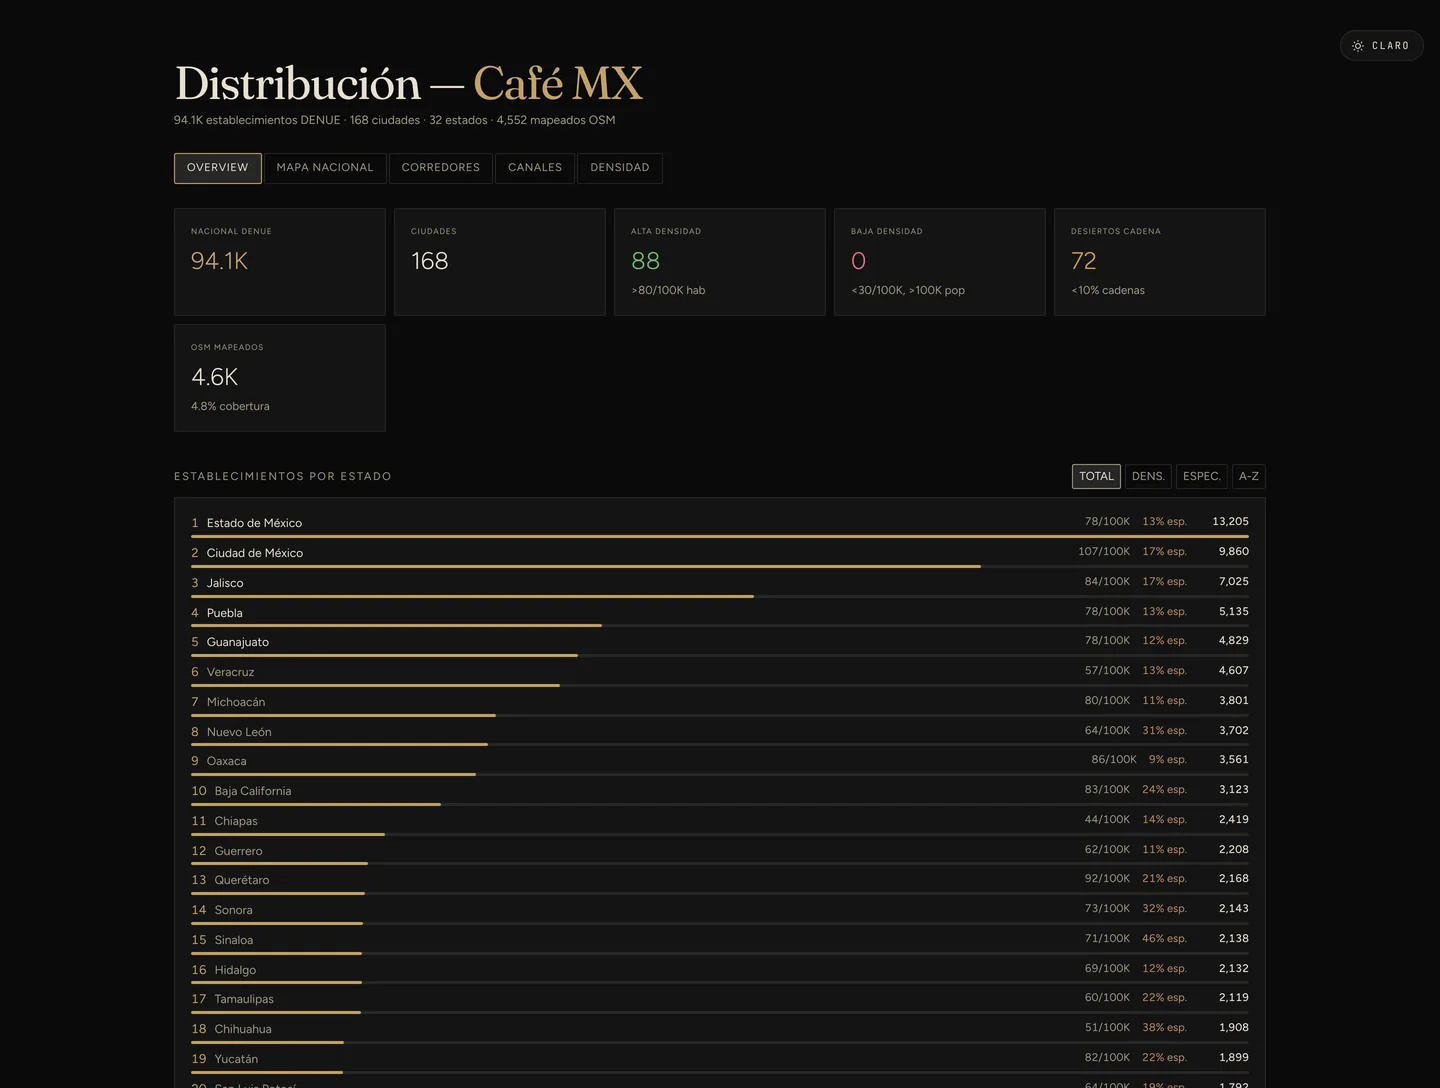
Distribution page: 94.1 thousand census establishments across 168 cities and 32 states, with the table of establishments by state, their density per hundred thousand inhabitants, and their specialty percentage.
GAnd where the point of sale is, counted. 94.1 thousand establishments from the national census across 168 cities and 32 states, ranked state by state with their density per hundred thousand inhabitants and what percentage is specialty. Three readings a sales manager uses the same day: 88 high-density cities, 72 "chain deserts" where chains cover less than 10%, and the open-map coverage declared at 4.8% — not hidden.
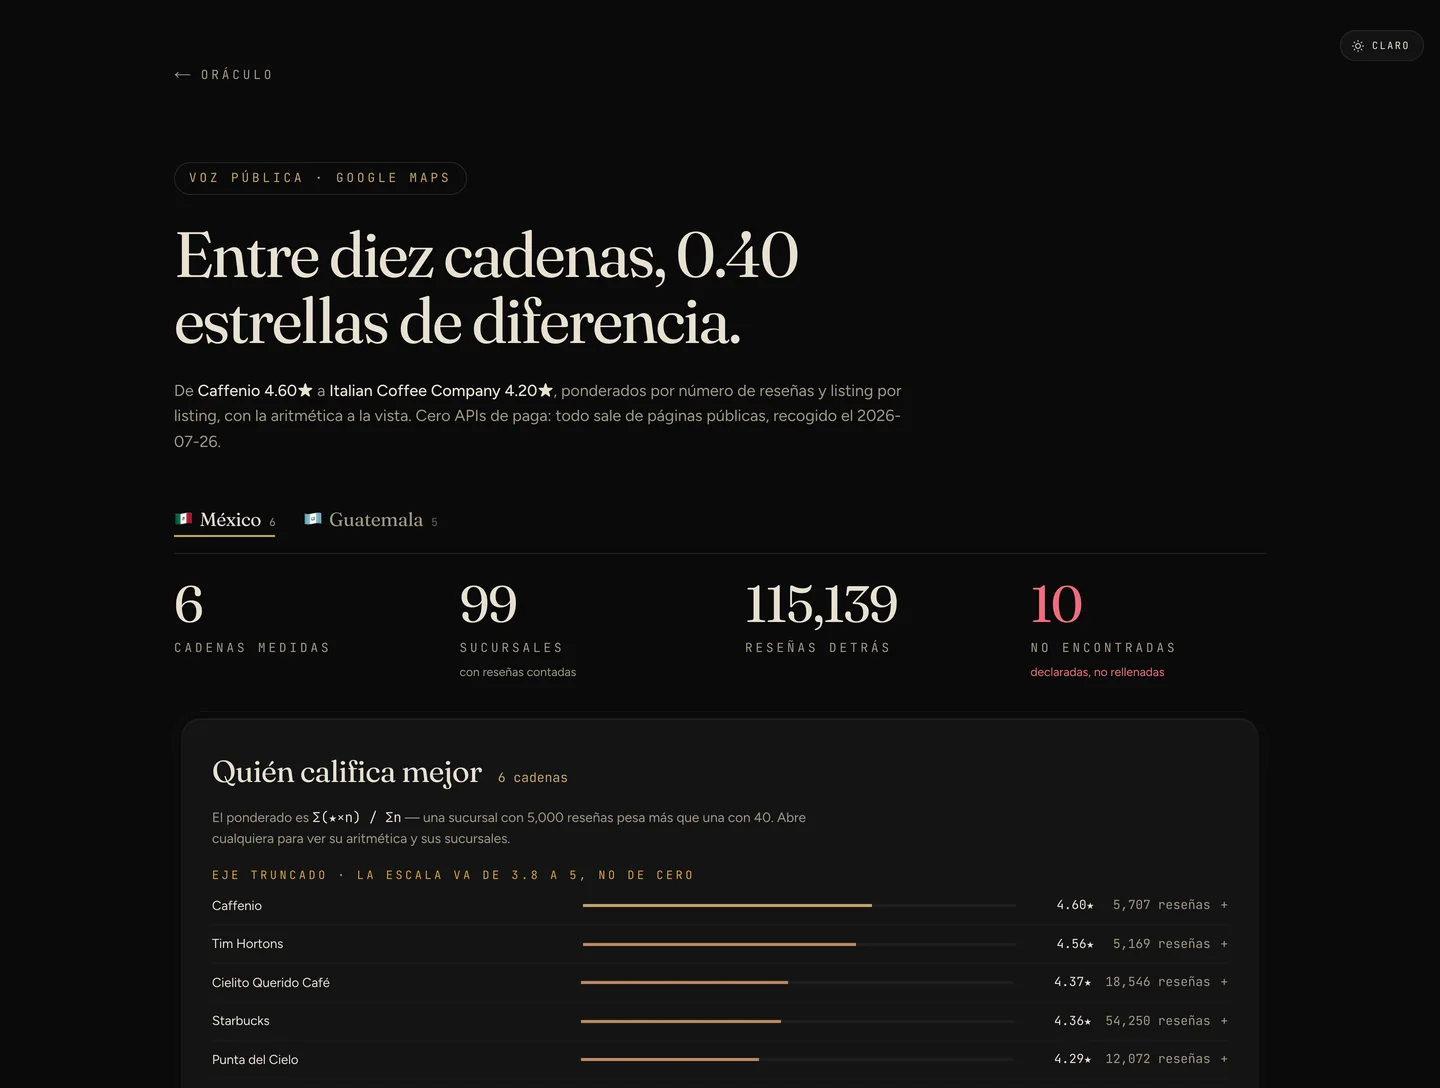
Public voice page: six chains measured with 115,139 reviews, their weighted rating, and a block that checks whether the original sample was biased.
HReal listening, no paid API. 115,139 reviews behind 99 branches of six chains, weighted by number of reviews —a branch with 5,000 carries more weight than one with 40— with the arithmetic in plain sight. Ten listings weren't found and are declared, not filled in. But the block to read is the one below, titled "the question that could have gone wrong": the study published 4.3★ without the capital, then checked whether that had inflated it. The result was a +0.015★ difference: noise, not signal. The instruction the file itself carries, in writing: "either result is valuable — do NOT force the one that sounds better."
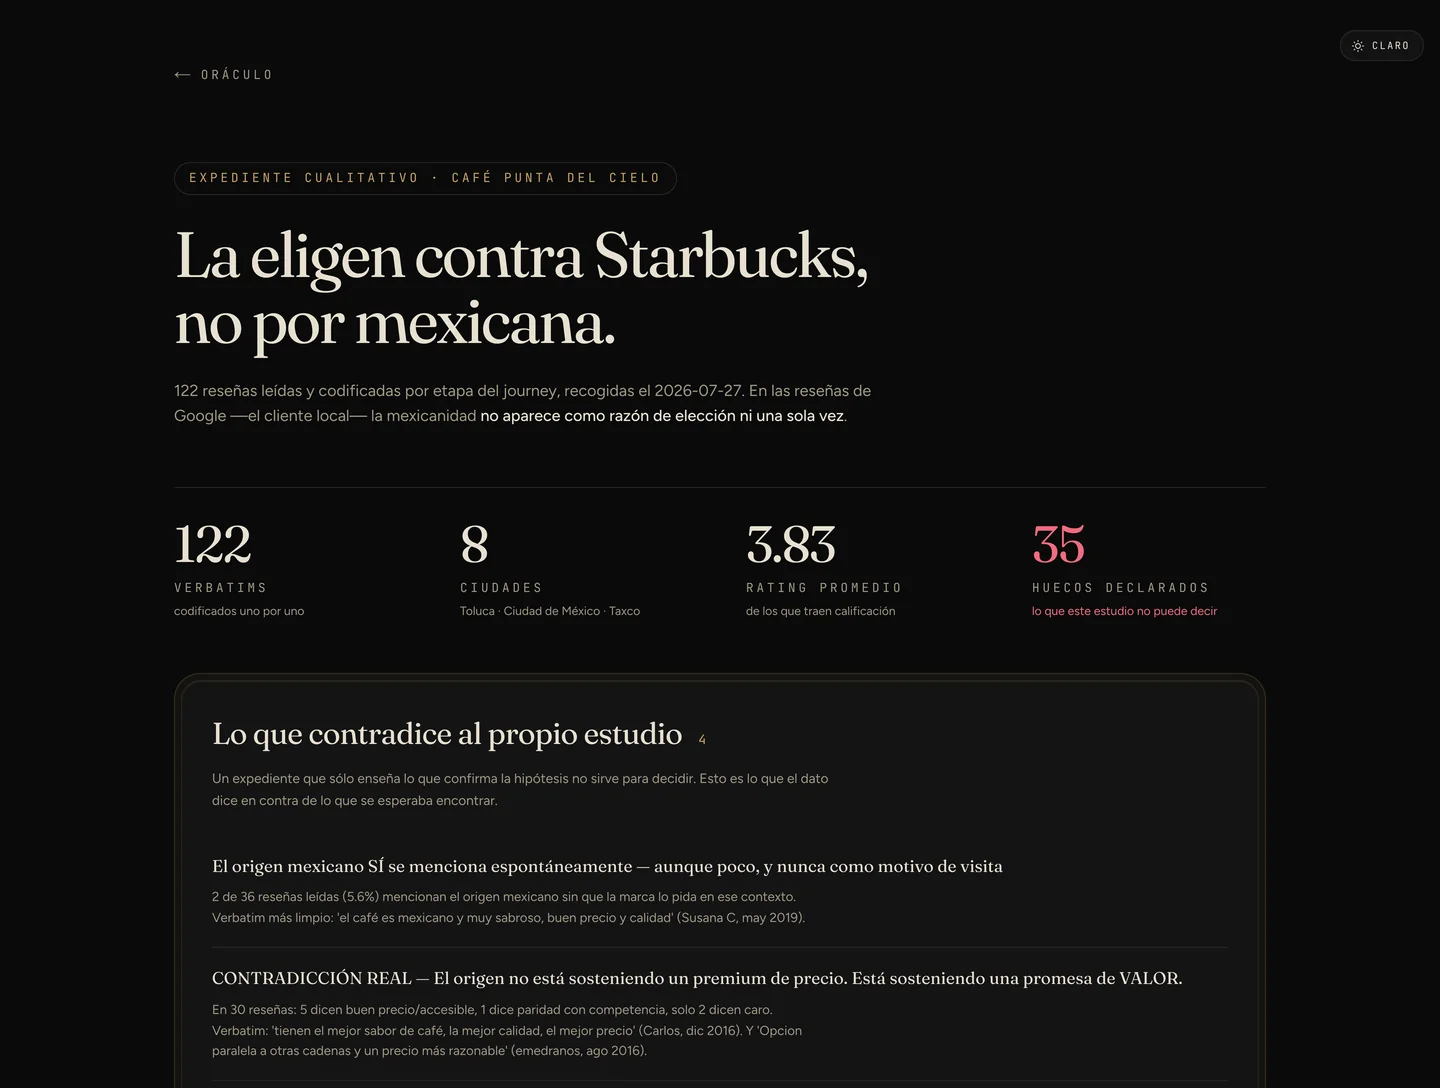
Qualitative file on a coffee chain read from 122 public reviews: four headline figures and a block titled what contradicts the study itself.
IA real qualitative study — and it dares to contradict itself. 122 public reviews read and coded one by one by stage of the journey, across 8 cities, with 35 declared gaps under the heading "what this study cannot say." The brand believed it was chosen for being Mexican. The data says otherwise: the origin is mentioned spontaneously in 2 of 36 reviews (5.6%) and never as a reason for visiting, while spontaneous comparison against the leading chain appears in 6 of 30 (20%) — 3.6 times more. And the conclusion no vendor wants to deliver: "the origin isn't sustaining a price premium; it's sustaining a value promise."
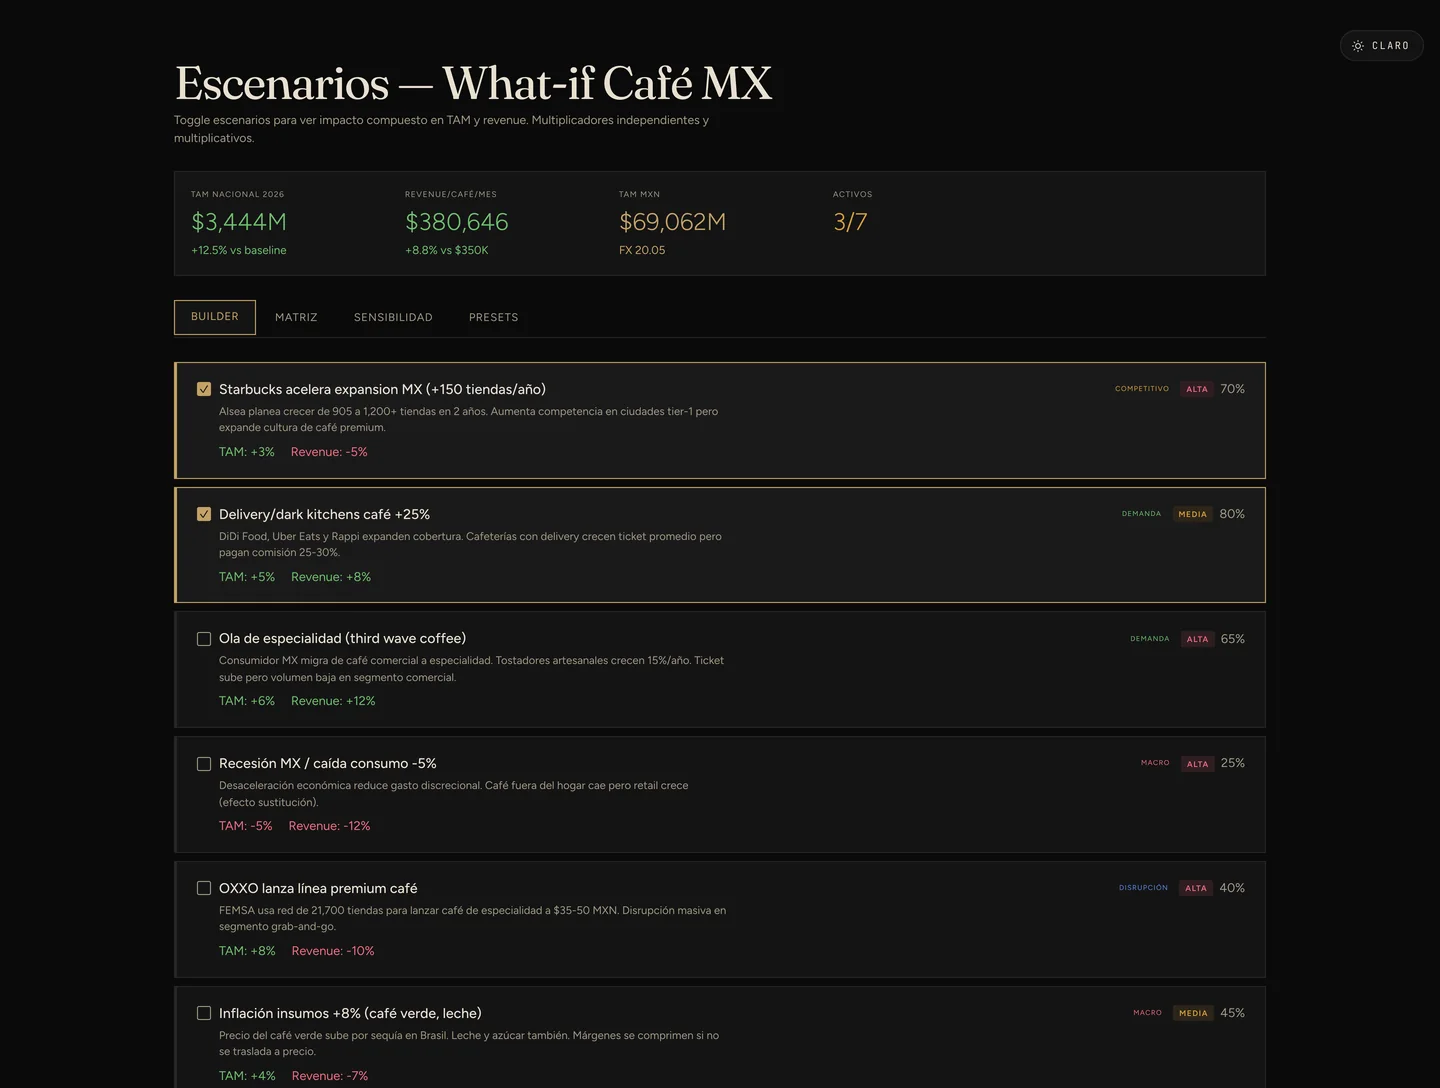
Scenario builder: seven assumptions with their probability and their effect on TAM and on revenue, with the composite result of the ones switched on shown above.
JThe "what if…?" with numbers, not adjectives. Seven assumptions each with its own switch —the leader accelerating openings, home delivery growing 25%, a recession, the convenience chain launching a premium line, input cost inflation, industrial relocation— each with its own probability and its separate effect on the market and on revenue. Switch them on and the header recalculates: with three active, TAM +12.5% and revenue +8.8%. The multipliers are independent and compound; that's written at the top, not in the fine print.
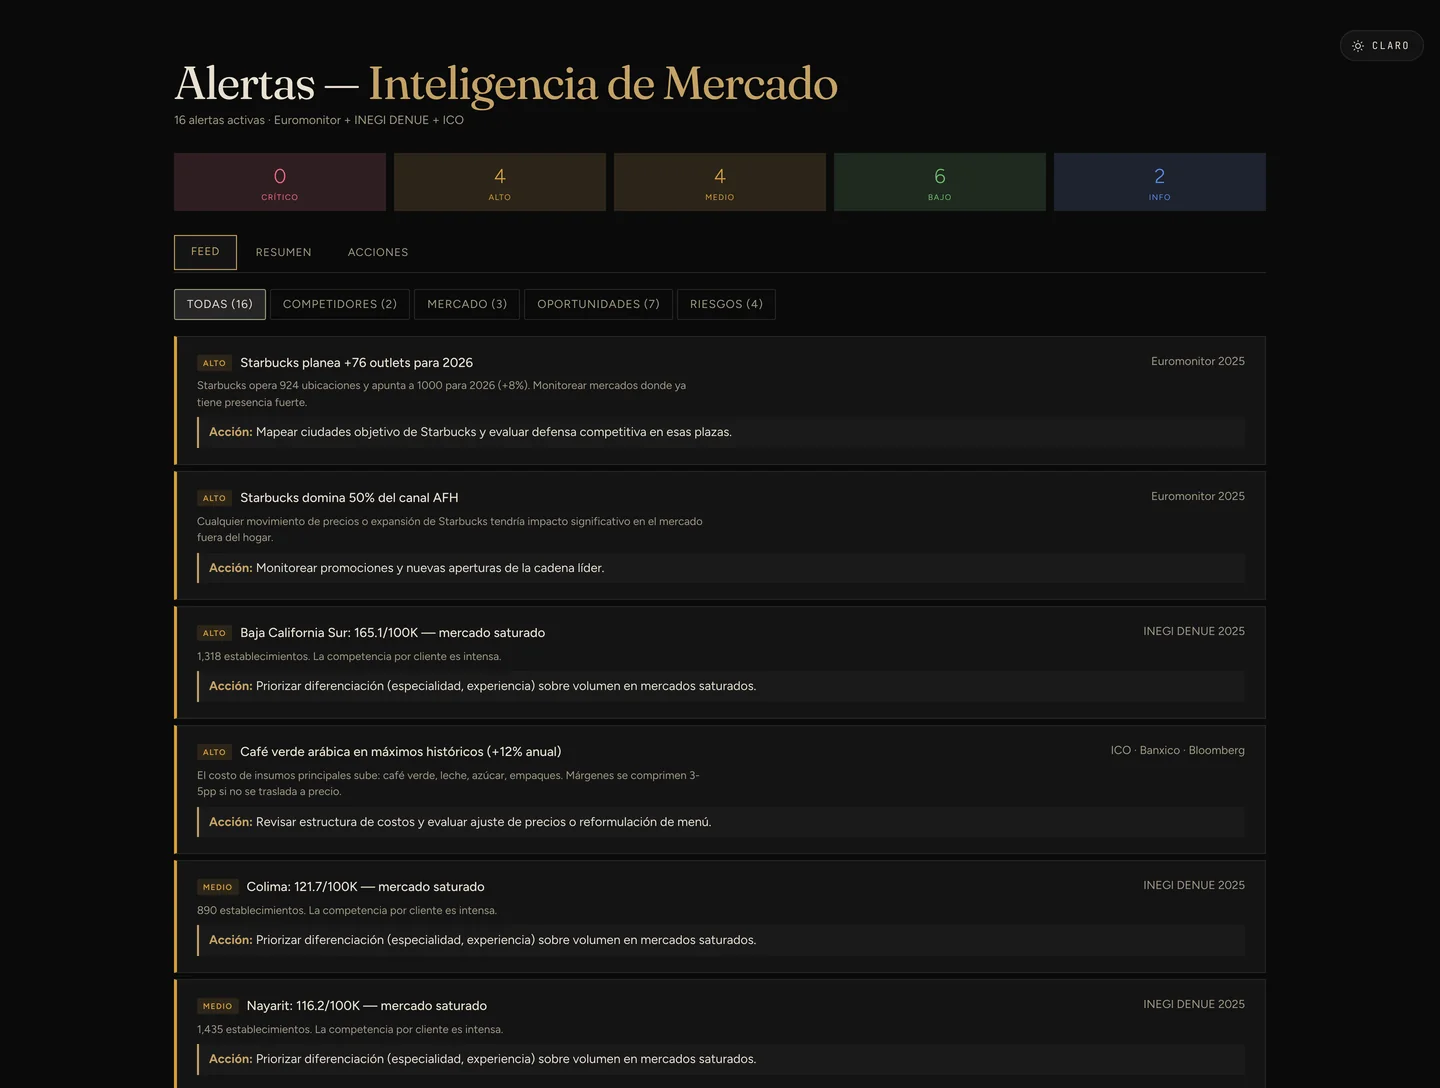
Market alerts feed: sixteen active alerts classified by severity, each with its source and a recommended action.
KAnd the digest that shows up on its own. 16 active alerts split by severity —zero critical, 4 high, 4 medium, 6 low— and by type: competitors, market, opportunities, risks. Each one carries its source and, below it, the action: "the leader plans +76 locations for 2026 → map their target cities and assess defense in those markets"; "arabica at highs, +12% annual → review cost structure before touching the menu." It isn't a newsletter: it's a list of things to do, with the evidence attached.
11screens in a single category dashboard
115,139real reviews behind the listening
35gaps declared in a single qualitative study
16active alerts, each with its action

How the focus group is run

Seven stages · a guide for moderating with real people, and the simulated session labeled as such

The first thing to say, because almost nobody says it: we don't recruit people. If you want a group with flesh-and-blood people, recruiting and the room are hired separately; we provide the guide and the analysis. And separately —with prior cost authorization, and labeled as what it is— the simulated session runs.

The guide's seven stages

1 · Opening
who they are, what they drink, with whom
2 · Warm-up
the category without naming the brand
3 · Body
habit, occasion, price, substitutes
4 · Stimulus
this is where the piece comes in: name, label, route, price
5 · Laddering
from attribute to benefit to value — why it matters to them
6 · Projective
what isn't said to your face
7 · Close
final objection and saturation

The four rules that make it work

What the system does do
  • The character knows who it is, and nothing moreits traits, its beliefs, its vocabulary
  • It counts the failureseach with its reason, and how many turns are missing
  • It estimates before spendingand doesn't run without explicit authorization
  • It checks words against numbersthe verbal choice against the conjoint's
What it forbids itself from doing
  • No percentagesa number coming out of a qualitative study is invalid
  • It isn't told what to concludenor what anchor to calibrate against
  • It doesn't silently drop casesthe old engine said n=500 and ran with 180
  • It doesn't present itself as real peopleit's labeled in the file, not in the fine print

If their words choose differently than their numbers, the qualitative is decoration — and the report says so.

That last step is the one nobody brings: at the end the character is shown the same profiles the conjoint already scored and what it chooses when it talks is compared against what its utility vector predicts. In Caribe Cooler's case that check came out 9 of 10, cohort by cohort — it's covered in full in the HUM△NS datasheet.

And the panel of experts, before spending

Four specialists · private label in a regulated category · August 2026

A campaign was ready to launch: three pieces, hero defined, a USD 300-a-day budget approved. Before turning it on it went through a panel of four specialists who work separately and don't read each other's work —platform compliance, paid media, the category, and brand and copy— because when four people arrive at the same objection on their own, that objection is real.

The three root errors they found

The hero was the wrong productthe competitor already owned it and it was commoditized even on marketplaces
changed
The promise didn't differentiatewhat they thought was their wedge was category table stakes: three competitors already offered it
rewritten
The problem wasn't trafficit was closing — and traffic was costing money that didn't come back
postponed

The math that stopped the spending

The media panel did the math nobody had done: at USD 300 a day, the acquisition cost came out to USD 900 to 1,110 per sale. Break-even required a ticket of USD 2,000 to 2,500. The real ticket ran between 800 and 1,200.

At that price, every new sale was losing money.

And the same dashboard held the way out: 163 people already quoted and stalled. Raising the close rate ten points over those 163 delivered the month's target without turning on a single ad. The revenue panel put it in money: USD 40 to 65 thousand in two weeks with a close rate of 15 to 22%, and with upsell and repeat purchase a floor of USD 140 thousand a month.

The verdict, piece by piece

Piece A · kill
it competed on price and was shooting at its own sister brand from the same house: two private labels bidding on the same click
Piece B · reposition
well written, but the brand story doesn't stop someone who doesn't know it; it goes to retargeting, not cold
Piece C · fix and approve
same format, a different promise: the one no competitor could copy that week

The panels aren't a nice opinion tacked onto the end of the project. They're four people with different trades looking for where the piece falls apart before you pay for it — and one of the four only looks at whether the ad sells, not whether it's pretty.

The client goes unnamed: TDI's library anonymizes unless given express authorization. The figures are the project's own, converted to dollars.

The segment snapshot — what Audiense can't give you

Vermouth · Guadalajara metropolitan area · run on September 15, 2026

Audiense portrays an audience with the follower graph of X: who follows whom. It's a good portrait and we're not going to copy it — because we don't have that source, and we say so plainly. Oráculo builds the portrait with sources you can re-run yourself, and grades every data point: MEASURED when it comes straight from the source, DERIVED when it's a stated calculation, JUDGMENT when it's a signed reading. One input, one sweep, one file.

The four blocks the engine runs, with their grade

Universe · MEASURED
INEGI, 2020 ITER Census — 4,119,160 people across the four municipalities, 2,943,707 over 18, 1,919,187 between 25 and 59; home internet 72.3%, cellphone 93.0%, car 58.8%
Interest · DERIVED
Five-year Google Trends — aperol went from 3.9 to 8.6 while gin fell from 16.1 to 14.3 and mezcal from 57.9 to 48.7; Jalisco over-indexes 1.25 on vermouth and 1.11 on aperol
Trade · MEASURED
DENUE by term — 2,898 bars in Jalisco, 449 of them in Guadalajara, and the count of wine shops and restaurants municipality by municipality
Shelf · MEASURED
Retailer API, the day's price — Cinzano at $225.40 against a list price of $322, Punt e Mes at $374.50, Aperol 700 ml at $283.50; and at the specialty store, from $361 to $519

And now the part nobody prints: what the snapshot does NOT include

What comes out measured and reproduces with a single command
  • Every number with its linkthe INEGI zip file, the product datasheet, the DENUE query
  • Every ad with its snapshotfive vermouth advertisers in the area, with their id in Meta's library
  • The cap, declared"restaurant" capped at 5,000 and the file says "underestimate"
  • A verification sheetrow by row: number, source, and how to reproduce it
The seven gaps, written into the file
  • The follower graph"no source (Audiense)" — and neither does the buyer's gender
  • A municipality that didn't resolveTlajomulco de Zúñiga doesn't appear in the ITER
  • The licensed panel is separatesize and shares are looked up by hand, with the session open
  • The psychographics are JUDGMENTand every trait is audited to cite two real texts

A portrait that doesn't say where each trait came from isn't a portrait: it's a drawing.

The case above is aperitif drinks in Guadalajara; the same engine ran functional coffee in Monterrey with the same four blocks. It's ordered by category and by market, and what arrives is the portrait plus the list of what it's missing —so you decide whether that gap is worth paying to close.

Every number says where it came from

The deliverable labels everything as measured, derived, or judgment, and includes a section on what that slide cannot claim. It's the part that's most uncomfortable at first and the most appreciated by month three.

And before quoting, we tell you what measures your category: whether it's already in a panel, whether it's reached through the consumer, or whether the source needs to be built from scratch — which we also do. It's said upfront, not afterward.

And if you already have something ready

Send me the campaign you're about to pay for.

Before the market tells you whether it worked —once it's already charged you for the mistake— we tell you. And if we have no way to measure your category, we tell you that too, no quote required.