The tools
SER.02 · Serebro ES
See it live

TDI / SER.02 · finds · The vault

Serebro™

Every category with its source, its year, and its gaps counted.

You ask it in Spanish, the way you'd ask in a meeting, and it answers with the number and with everything you need to trust it: its source, its year, its sample, and its grade —MEASURED if it comes straight from the source, DERIVED if it's a stated calculation, JUDGMENT if it's a signed reading—. It doesn't invent: it retrieves evidence from a controlled vault and builds the answer on top of it. If the data doesn't exist, it says so.

Size and forecast
how much the category is worth and where it's headed
Share
by brand and by company, in value
Channel
how much sells at the bar and how much in stores
Price
the day's shelf price and field price, by establishment
Customs
what enters the country, from where, and from which competitor
Listening
seven platforms, by market and by city
Census
establishments counted, not estimated

Who it's for, and what question they bring
Brand director“how big is my fight?”
Size, growth, channel, and who leads your category — and in exactly which subcategory, not the sector average. With the year of the data in plain sight so nobody argues it's stale.
Insights“can this be defended?”
Every number with its source, its unit, and its grade. And the gaps counted: 53 declared in the coffee library. It's what you bring to a methodology review without breaking a sweat.
Sales“where do I get in?”
How much is drunk away from home against how much off the shelf, and the concentration of each subcategory. A market with a CR3 of 88 isn't attacked the same way as one with 34.
Executive leadership“are we in the right country?”
The same yardstick across 210 countries. And when a market isn't covered, it says so before you ask — it doesn't fill the gap with an estimate.
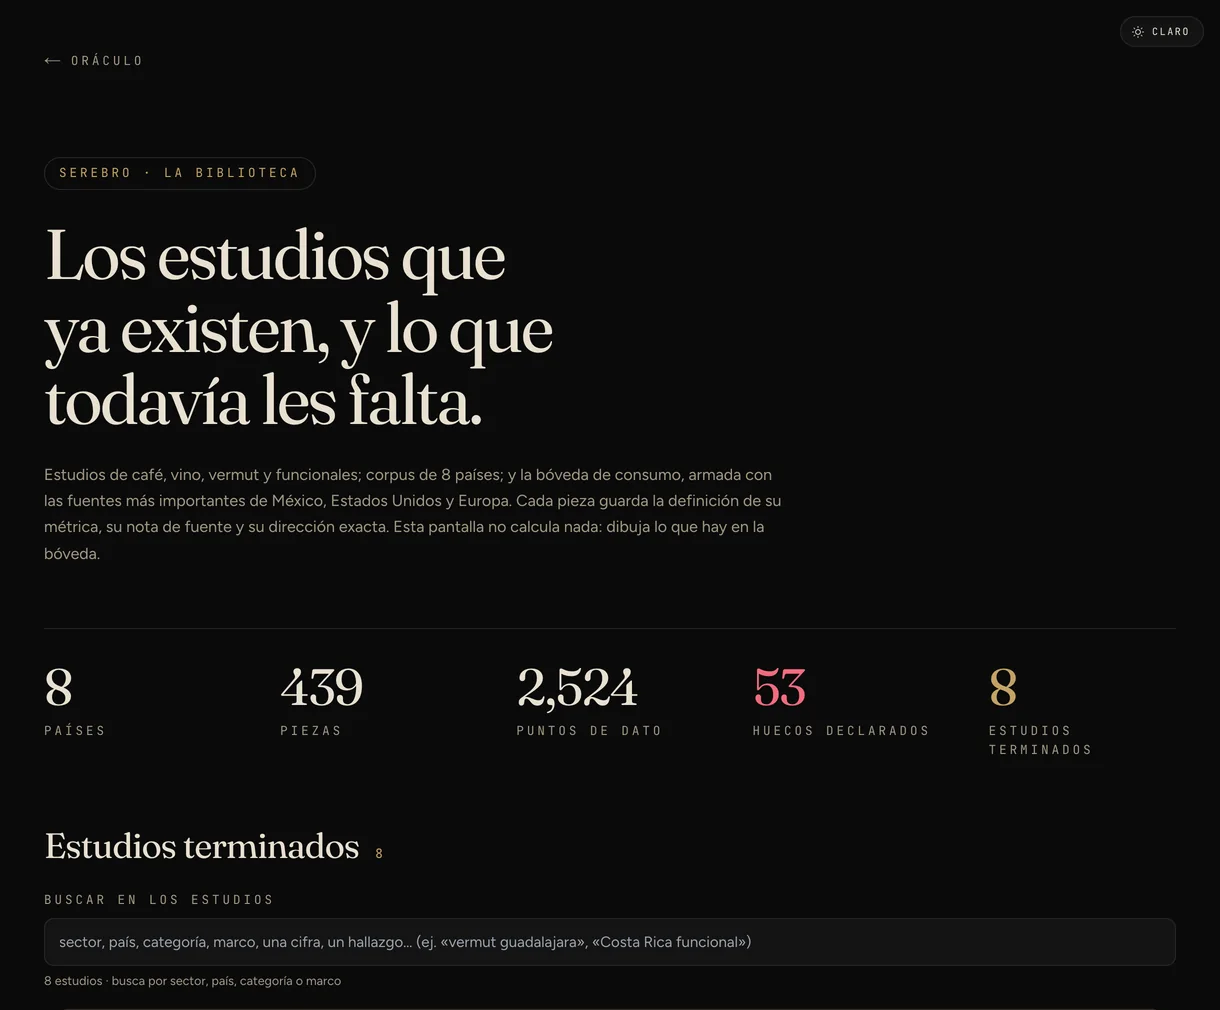
Serebro screen: 8 countries, 439 pieces, 2,524 data points, 53 declared gaps, and 8 finished studies, with a study search bar.
ASerebro, the library. What's in the vault, counted: 8 countries, 439 pieces, 2,524 data points and 53 declared gaps. That last counter is the one no platform shows — it's the list of what we still don't have, published right alongside what we do.
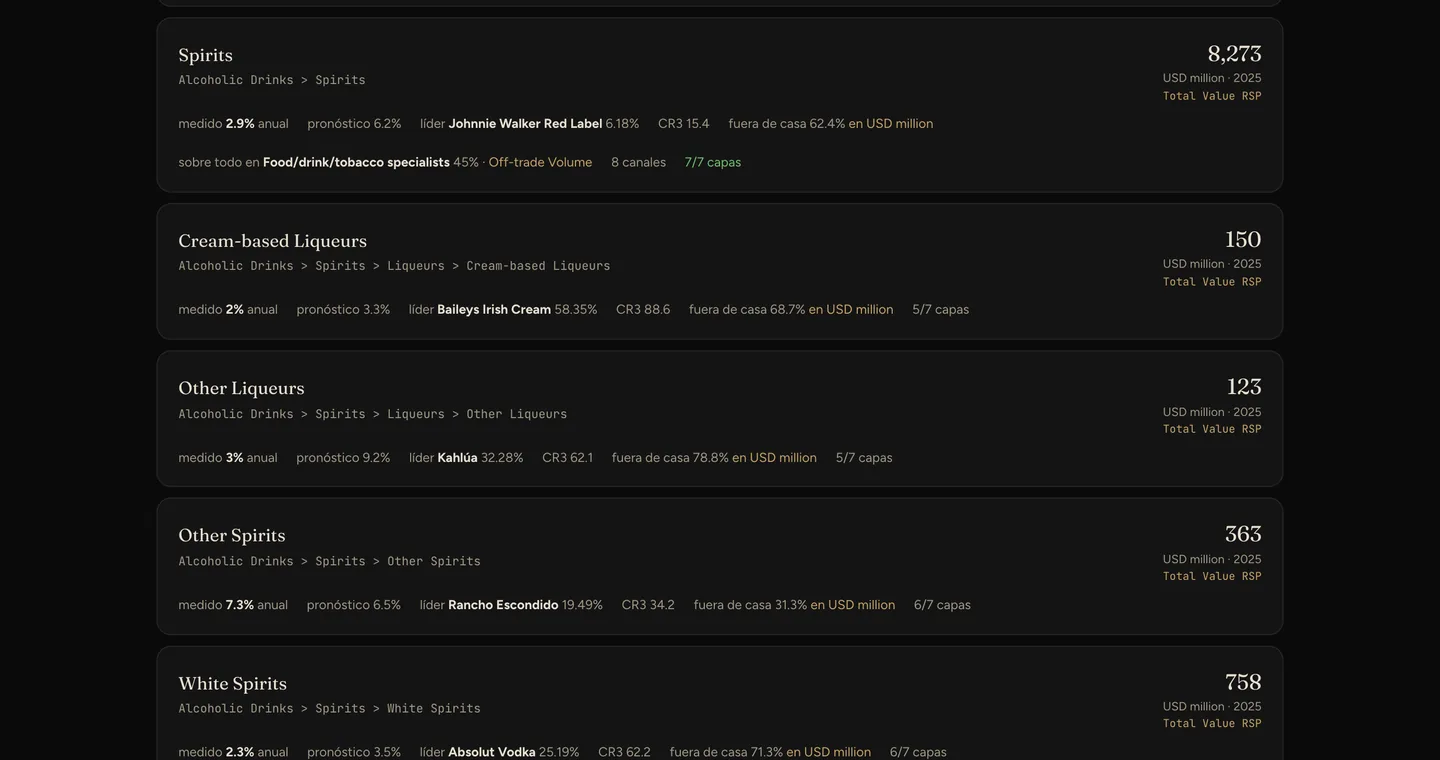
List of spirits and liqueurs subcategories: each with its value in millions of dollars, its measured and forecast growth, the leading brand with its share, the CR3 concentration index, and how much is drunk away from home.
BOne question, and the whole category tree. You type "liqueurs" and out come the subcategories with what a brand director needs in a single row: Other Liqueurs $123 M with Kahlúa at 32.28%, Bitters $92.2 M with Jägermeister at 60.62%, White Spirits $758 M with Absolut at 25.19%. Each with its CR3 —how concentrated it is— and how much is drunk away from home, which is the difference between fighting on the shelf or at the bar. And the counter on the left tells you how many of the seven layers have data.
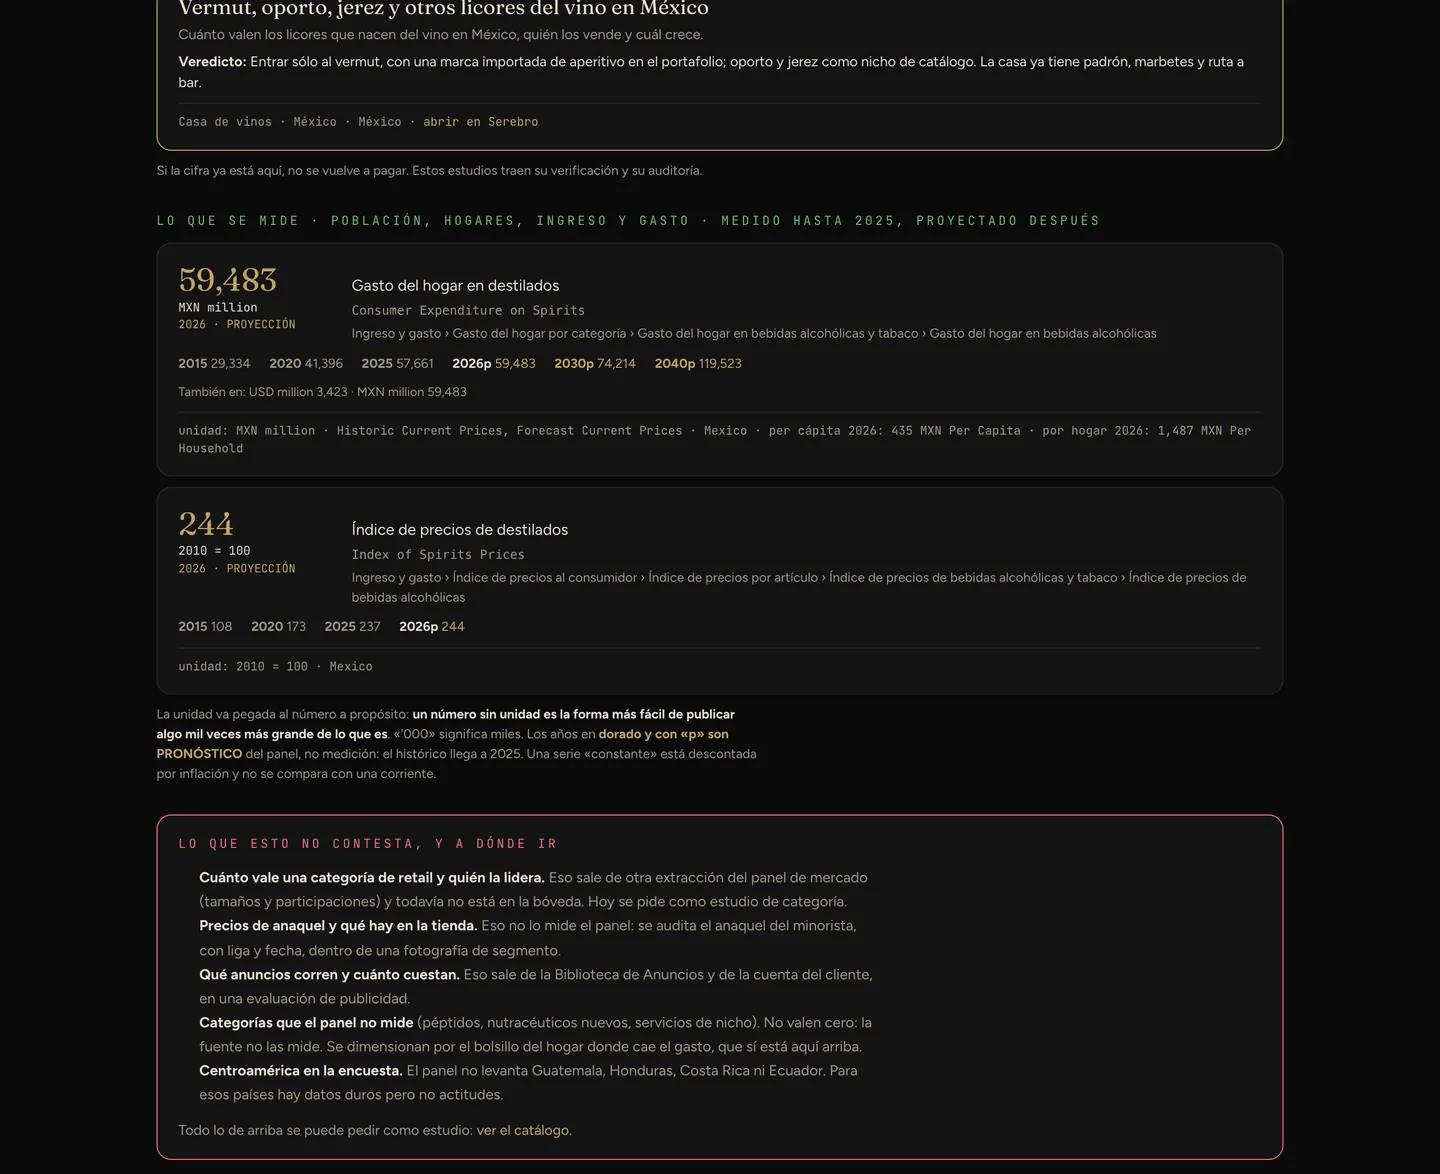
The vault's answer: household spending on spirits with its 2015-to-2040 series, its unit, its per-capita and per-household figures; below, a red box titled «what this doesn't answer, and where to go».
CAnd here's the part no other tool includes. The answer carries its full series —$59,483 M in household spending on spirits in 2026, with 2015, 2020, 2025 and a projection to 2040—, its unit, its per-capita and its per-household figures. Below, in red, "what this doesn't answer, and where to go": that this panel doesn't measure shelf price, that the categories the source doesn't cover don't equal zero, and that Central America isn't in the survey. Every gap with the door you need to knock on.
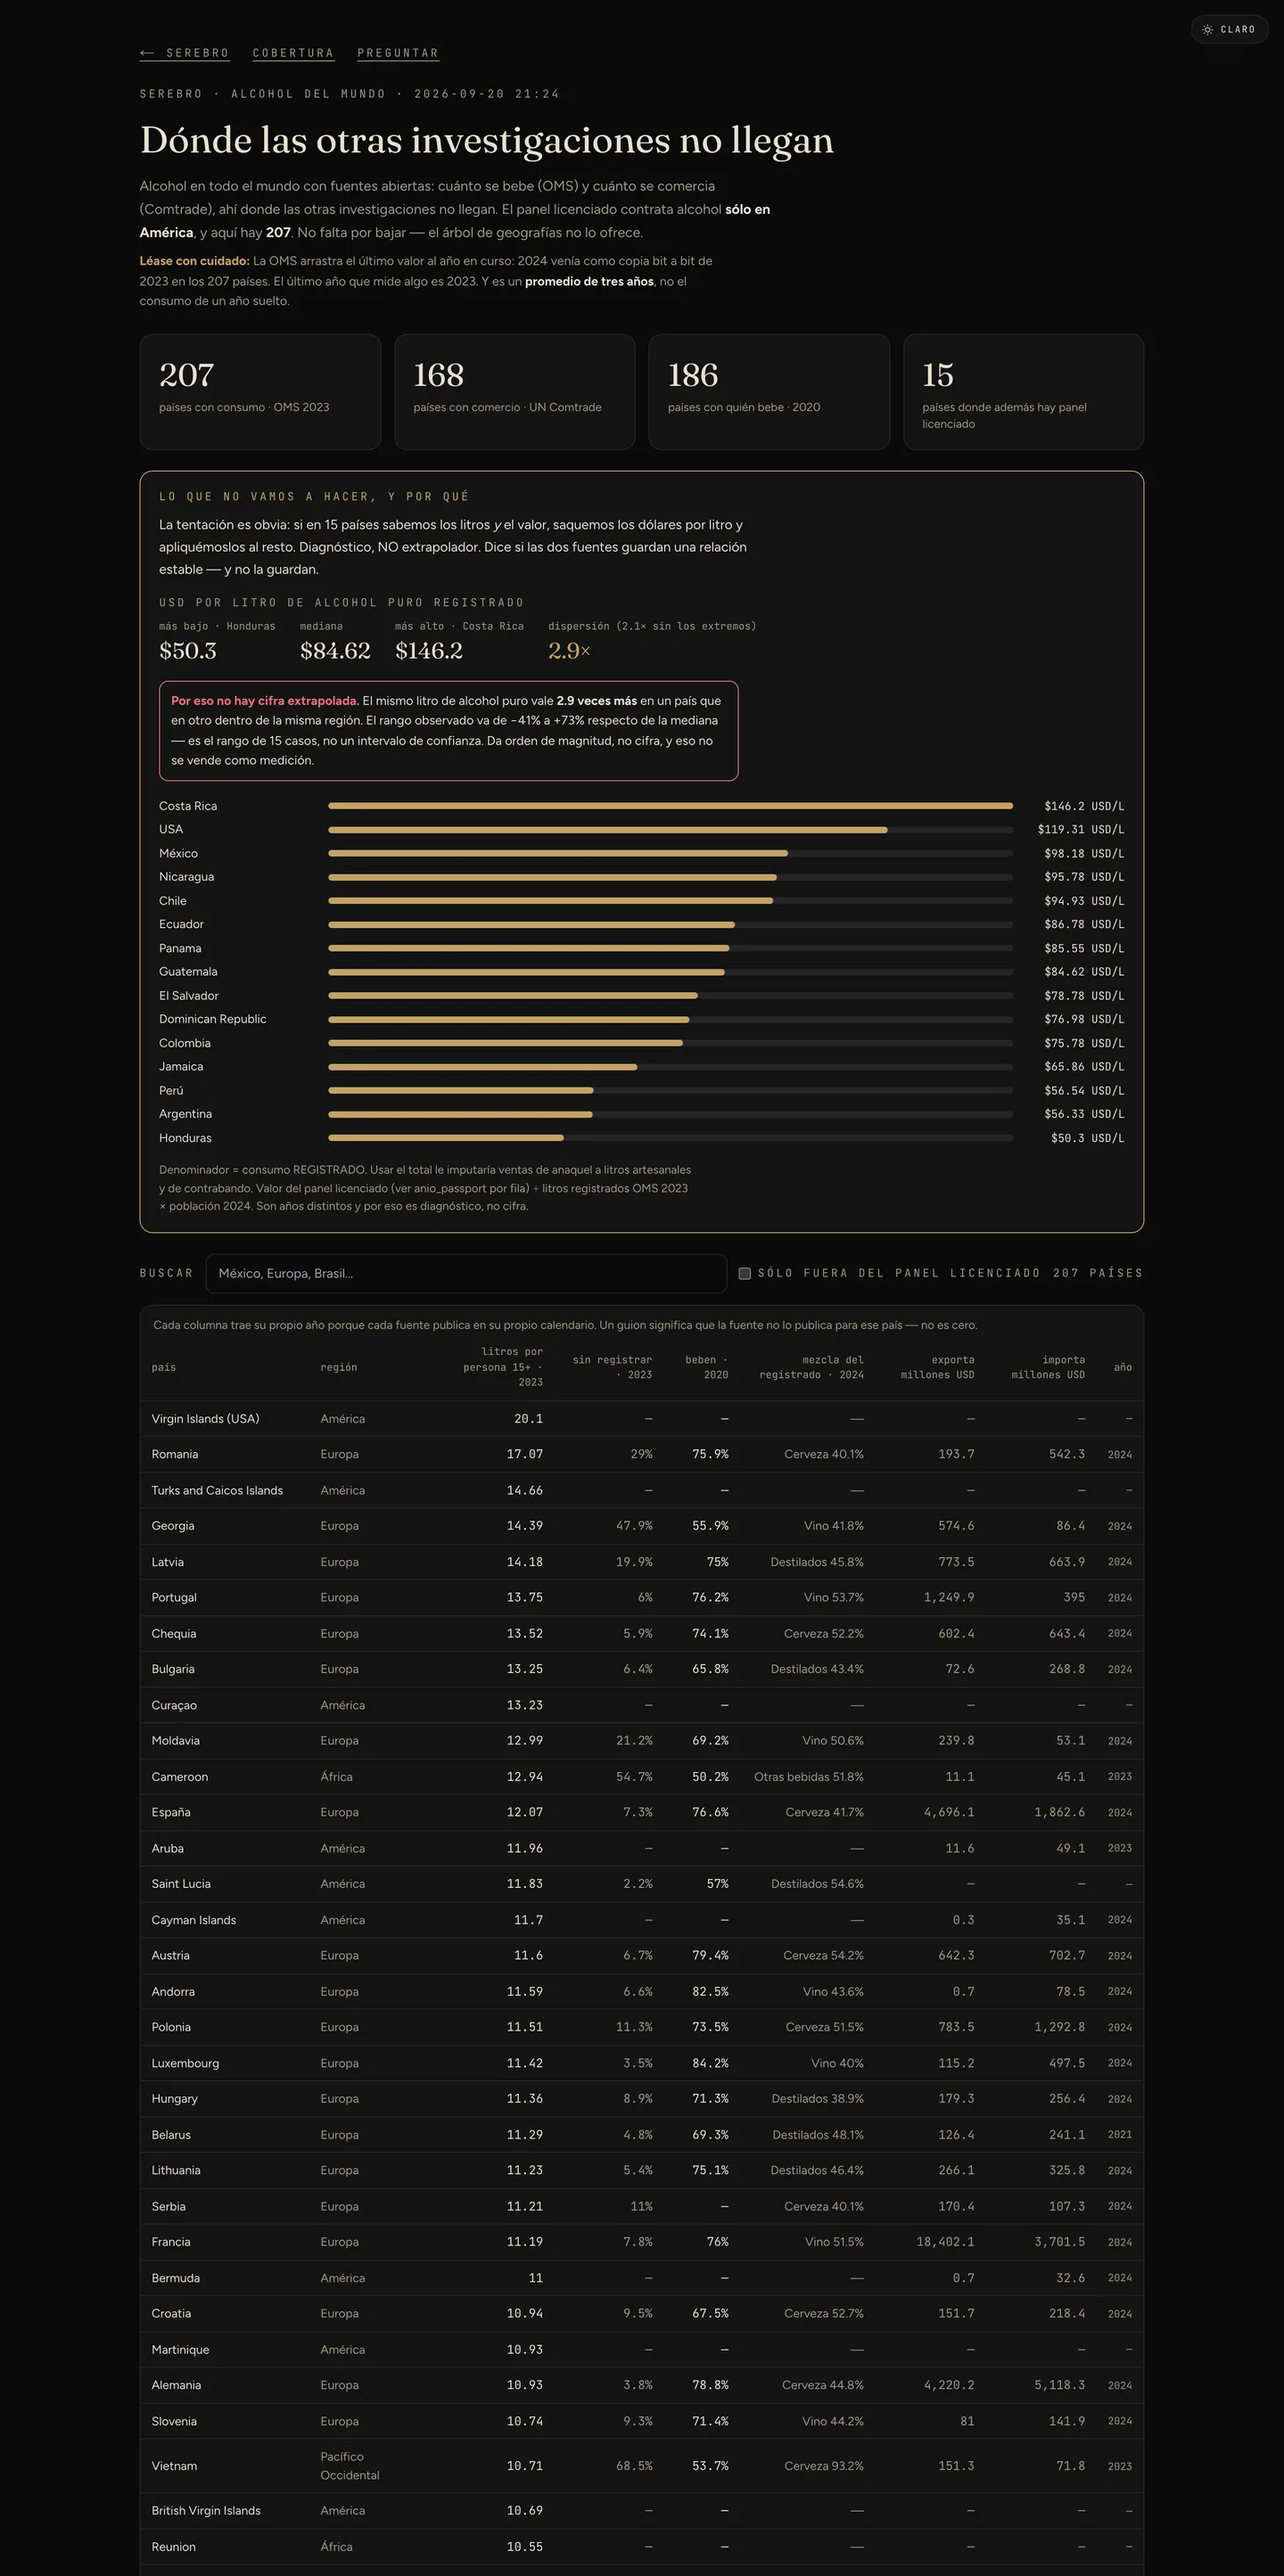
Coverage screen: alcohol in 207 countries with WHO data and 168 with Comtrade trade data, with the warning that no extrapolated figure is published, and the country-by-country table.
DWhere other research doesn't reach — and why we don't fill it in. Alcohol in 207 countries with WHO consumption data and 168 with Comtrade trade data, right where the panel only covers the Americas. And in between, the box that explains what we're not going to do: with 15 countries you know the liters and the value, it would be easy to pull a dollar-per-liter figure and apply it to the rest —but that same liter is worth 2.9 times more in one country than another within the same region. "It gives order of magnitude, not a figure, and that's not sold as measurement." Spain shows up with its 12.07 liters per person and its 4,696 M USD in exports.
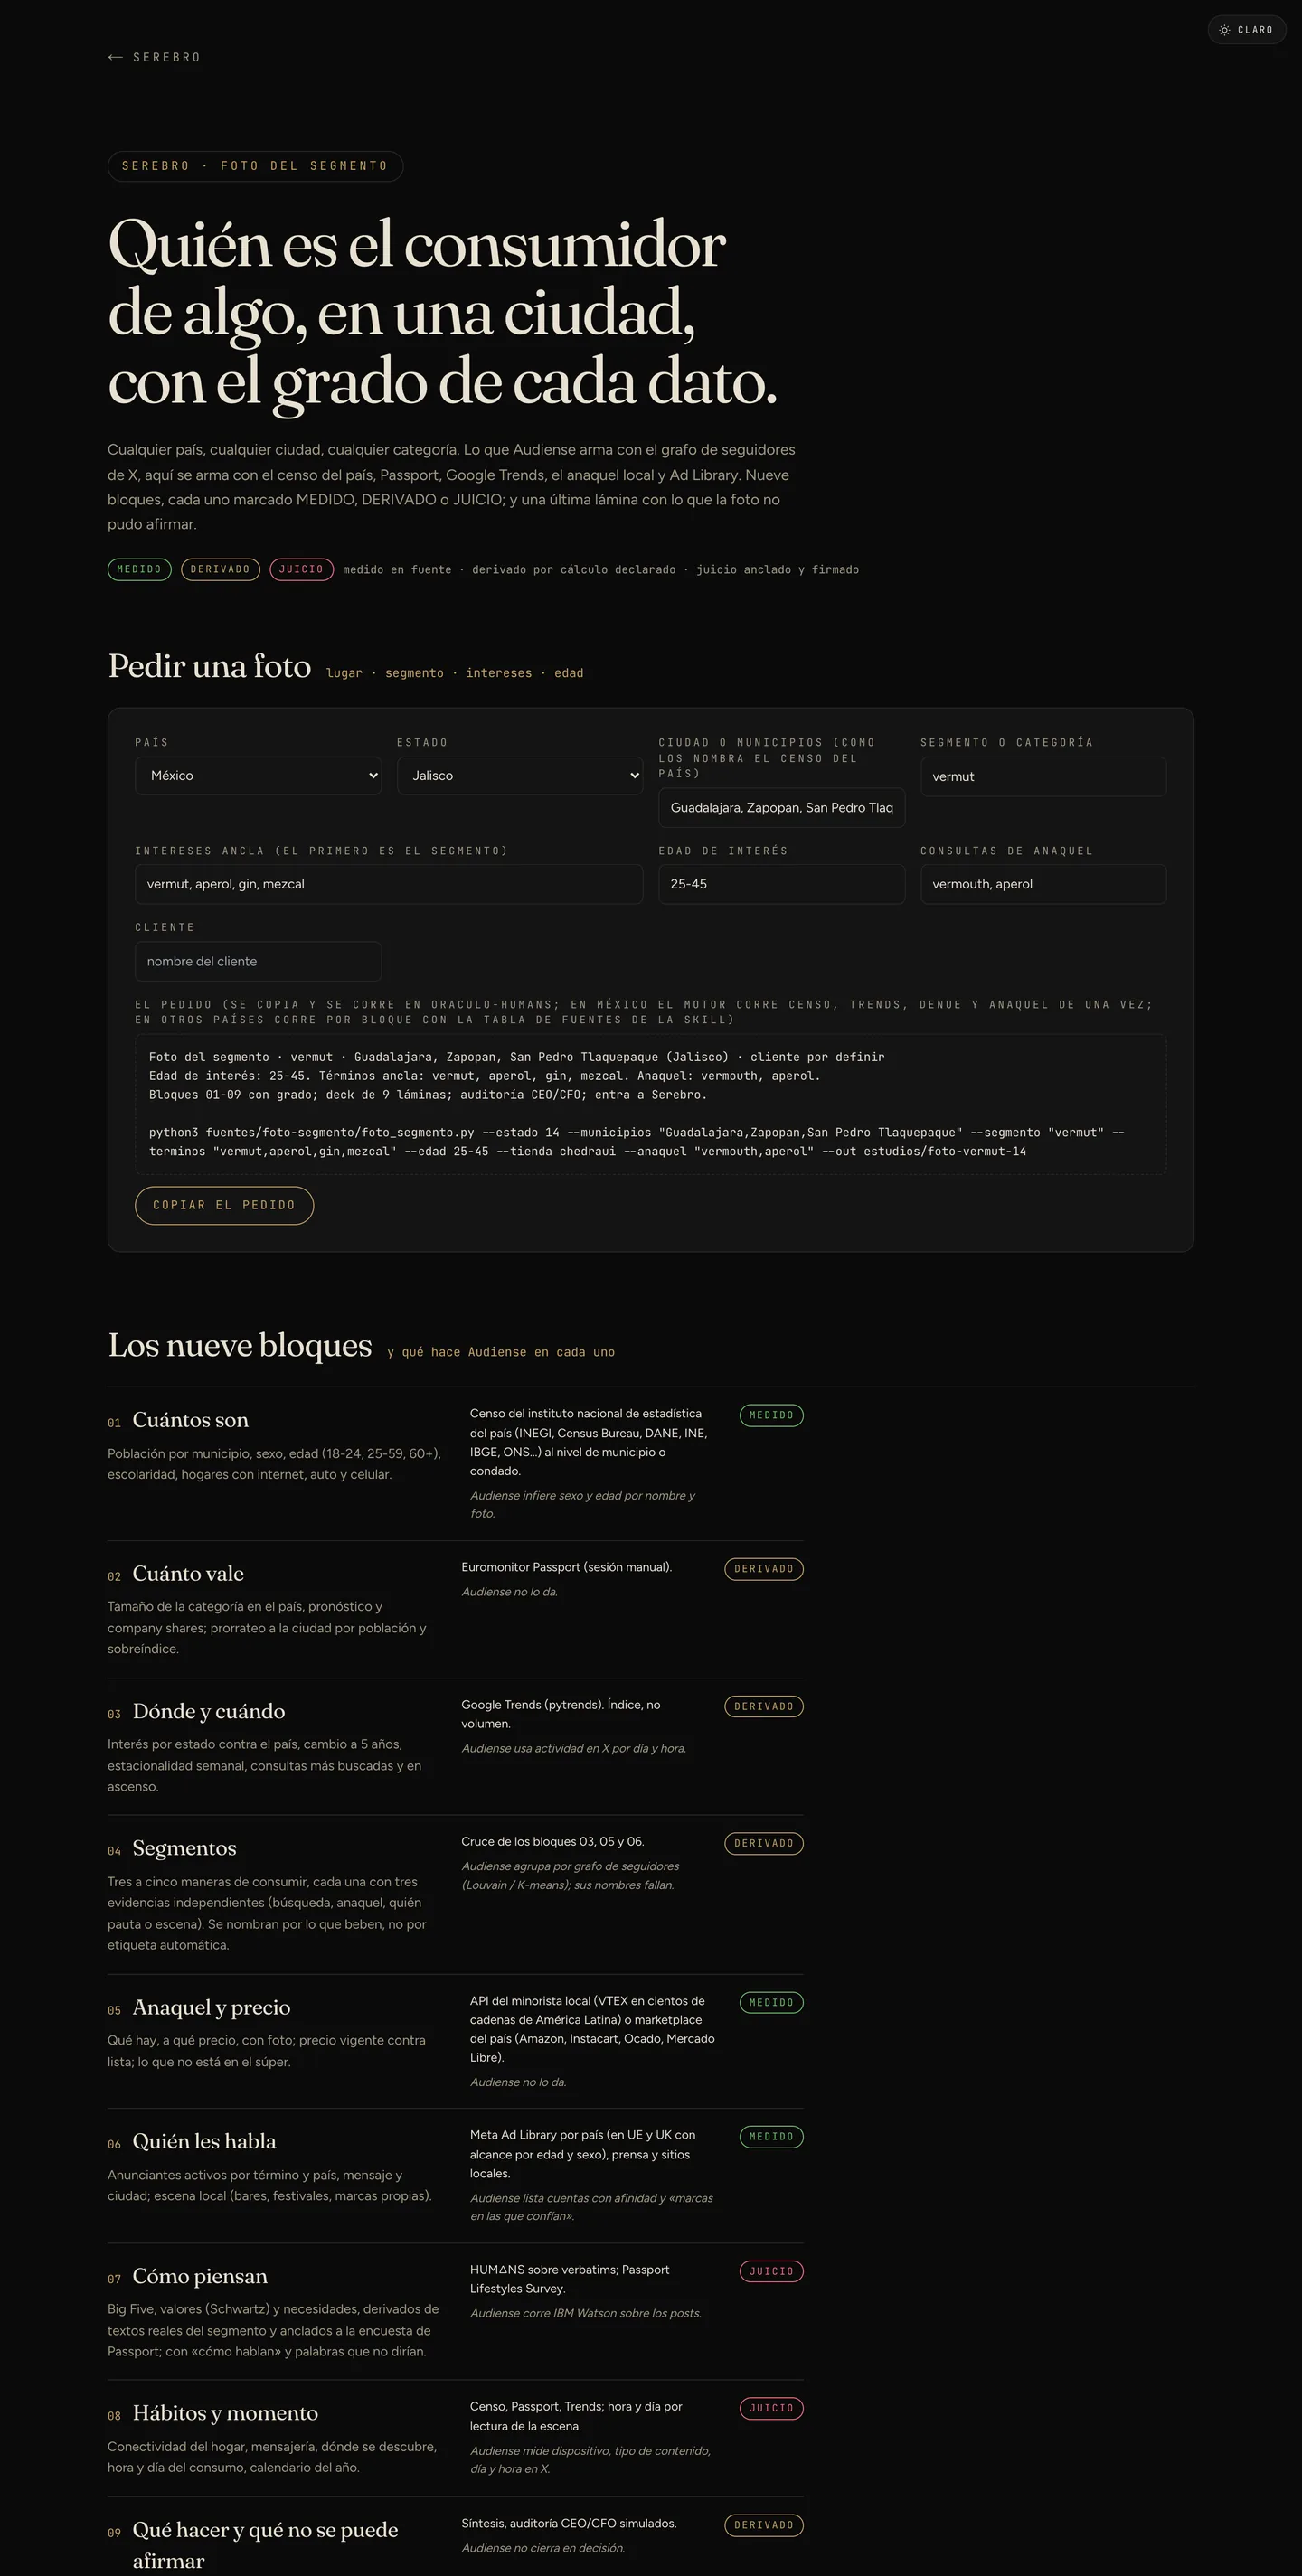
Segment snapshot screen: who the consumer of a category is in a given city, with the grade of each data point.
EAnd when the question is "who's buying from me." The segment snapshot comes out of this same vault: census, local trade, search trends, and shelf with prices, each block with its grade. It's covered in full in Oráculo's datasheet — what matters here is that it isn't another product: it's the vault answering a different question.
75,912categories in the vault, across 210 countries
938datasheets with all seven layers complete, out of 75,912
23public sources, tested every day
486,182branch prices collected in the field by PROFECO
6.1 Mestablishments in the Mexican census

How far it reaches

Coverage changes by market and by layer, and we confirm it in writing before starting, with your category and your countries right in front of us. Where one layer doesn't reach, there's usually another route — that's handled case by case.

A method note: the field price compares chain against chain, it doesn't describe a country's price. It's worth knowing before you cite it.

And if you already have something ready

Send me the campaign you're about to pay for.

Before the market tells you whether it worked —once it's already charged you for the mistake— we tell you. And if we have no way to measure your category, we tell you that too, no quote required.