TDI / TER.04 · locates · The territory, market by market
Terra
Which market to open first, with what model, and in how many months it pays for itself.
It isn't another product: it's the shape the engine takes when, instead of
answering standalone questions, it becomes a category's territorial platform. The client
doesn't log in to ask an AI a question — they log in to see their territory: their
markets, their prices, their competitors' prices, where they have a distributor and where they don't.
It runs today for Cesantoni in ceramic floor tile and bathroom fixtures. The screens
below are from that dashboard, taken from the live product: 109 markets, five categories,
as of August 10, 2026.
Every market with its number
TAM, SAM, SOM, year-one capture, and a written verdict
Segment and socioeconomic level
four construction tiers and the market's A/B, C+, and C household split
Buyer personas
who signs off, with what budget per square meter, and through which channel
Competitors
census from the national business directory, not a purchased list
Comparable price
per measured unit, and only across formats the brand actually makes
Catalog with photos
harvested from the distributor's own listing
Satellite
dated passes to see where construction appeared that wasn't there before
Channel disparity
the brand's own product, at a different price depending on who sells it
Who it's for, and what question they bring
Executive leadership“where do I open first?”
The 109 markets scored from 0 to 100, with total and reachable market, the entry model, the investment, and how many months it takes to pay for itself.
Sales“who am I fighting in that market?”
The territory's competitor census and the comparable price per measured unit — with the product's photo and its link.
Commercial director“is my own pricing in order?”
The finding that moved the most money wasn't about the competition: the house's own SKU with a +63% gap between distributors.
Insights“where does that score come from?”
From thirteen published components, traceable one by one. None of them is a black box: you can see each one's weight and discuss it.
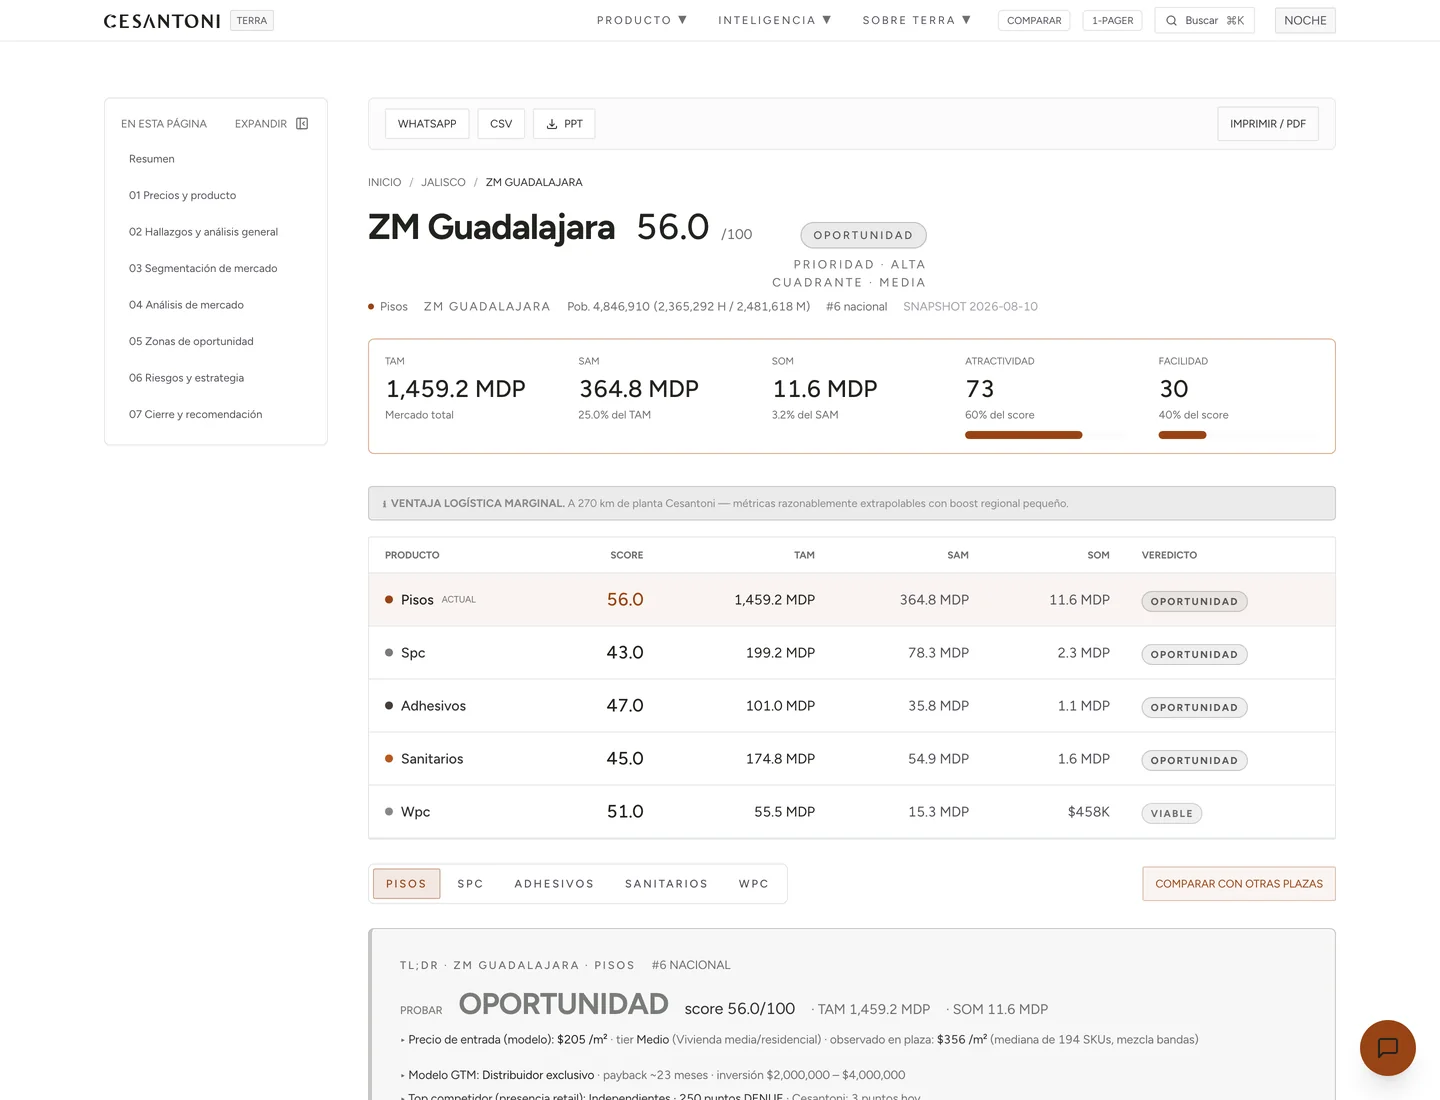
AA market, with its number and its verdict. ZM Guadalajara, floor tile:
score 56.0/100, TAM 1,459.2 MDP, SAM 364.8, SOM 11.6 MDP, attractiveness 73,
ease 30, #6 nationally out of 4.8 M inhabitants. Below, the house's five products measured
in the same market. And the row a sales director reads first:
the model's entry price of $205/m² against $356/m² observed across 194 real SKUs.
The model was coming in short, and the market says so.
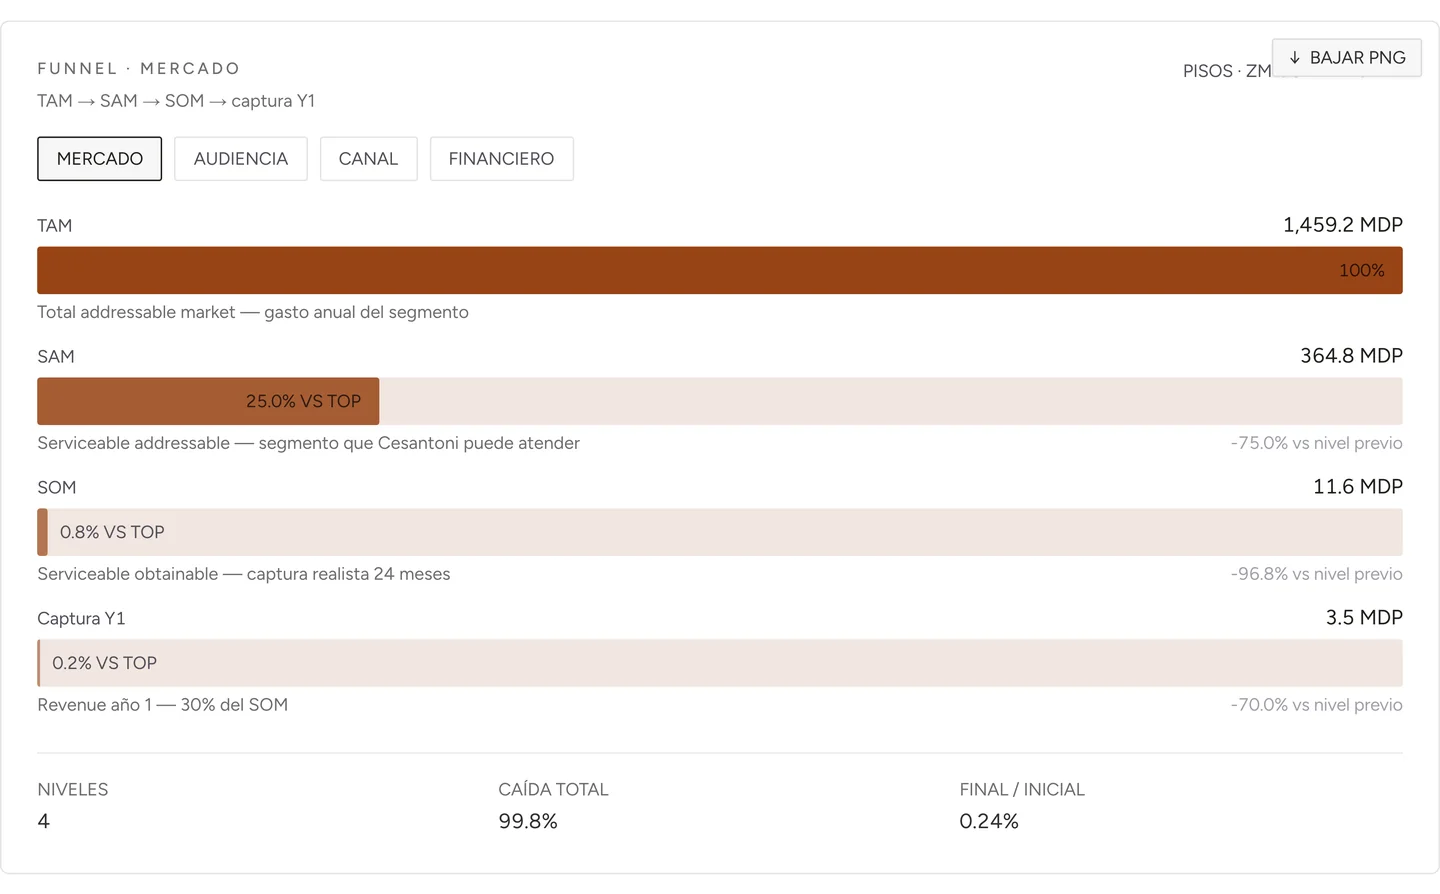
BThe TAM, the SAM, and the SOM — and the fourth step almost nobody includes.
TAM 1,459.2 MDP (the segment's annual spend) → SAM 364.8 MDP, the 25% the
brand can serve → SOM 11.6 MDP, the realistic 24-month capture → and
year-1 capture: 3.5 MDP. Each step says how much it lost against the previous one
(−75.0%, −96.8%, −70.0%) and at the bottom sits the uncomfortable figure: total
drop 99.8%. A huge TAM isn't a promise; it's the ceiling you fall from. And the four
tabs above run the same funnel by market, by audience, by channel, and by finance.
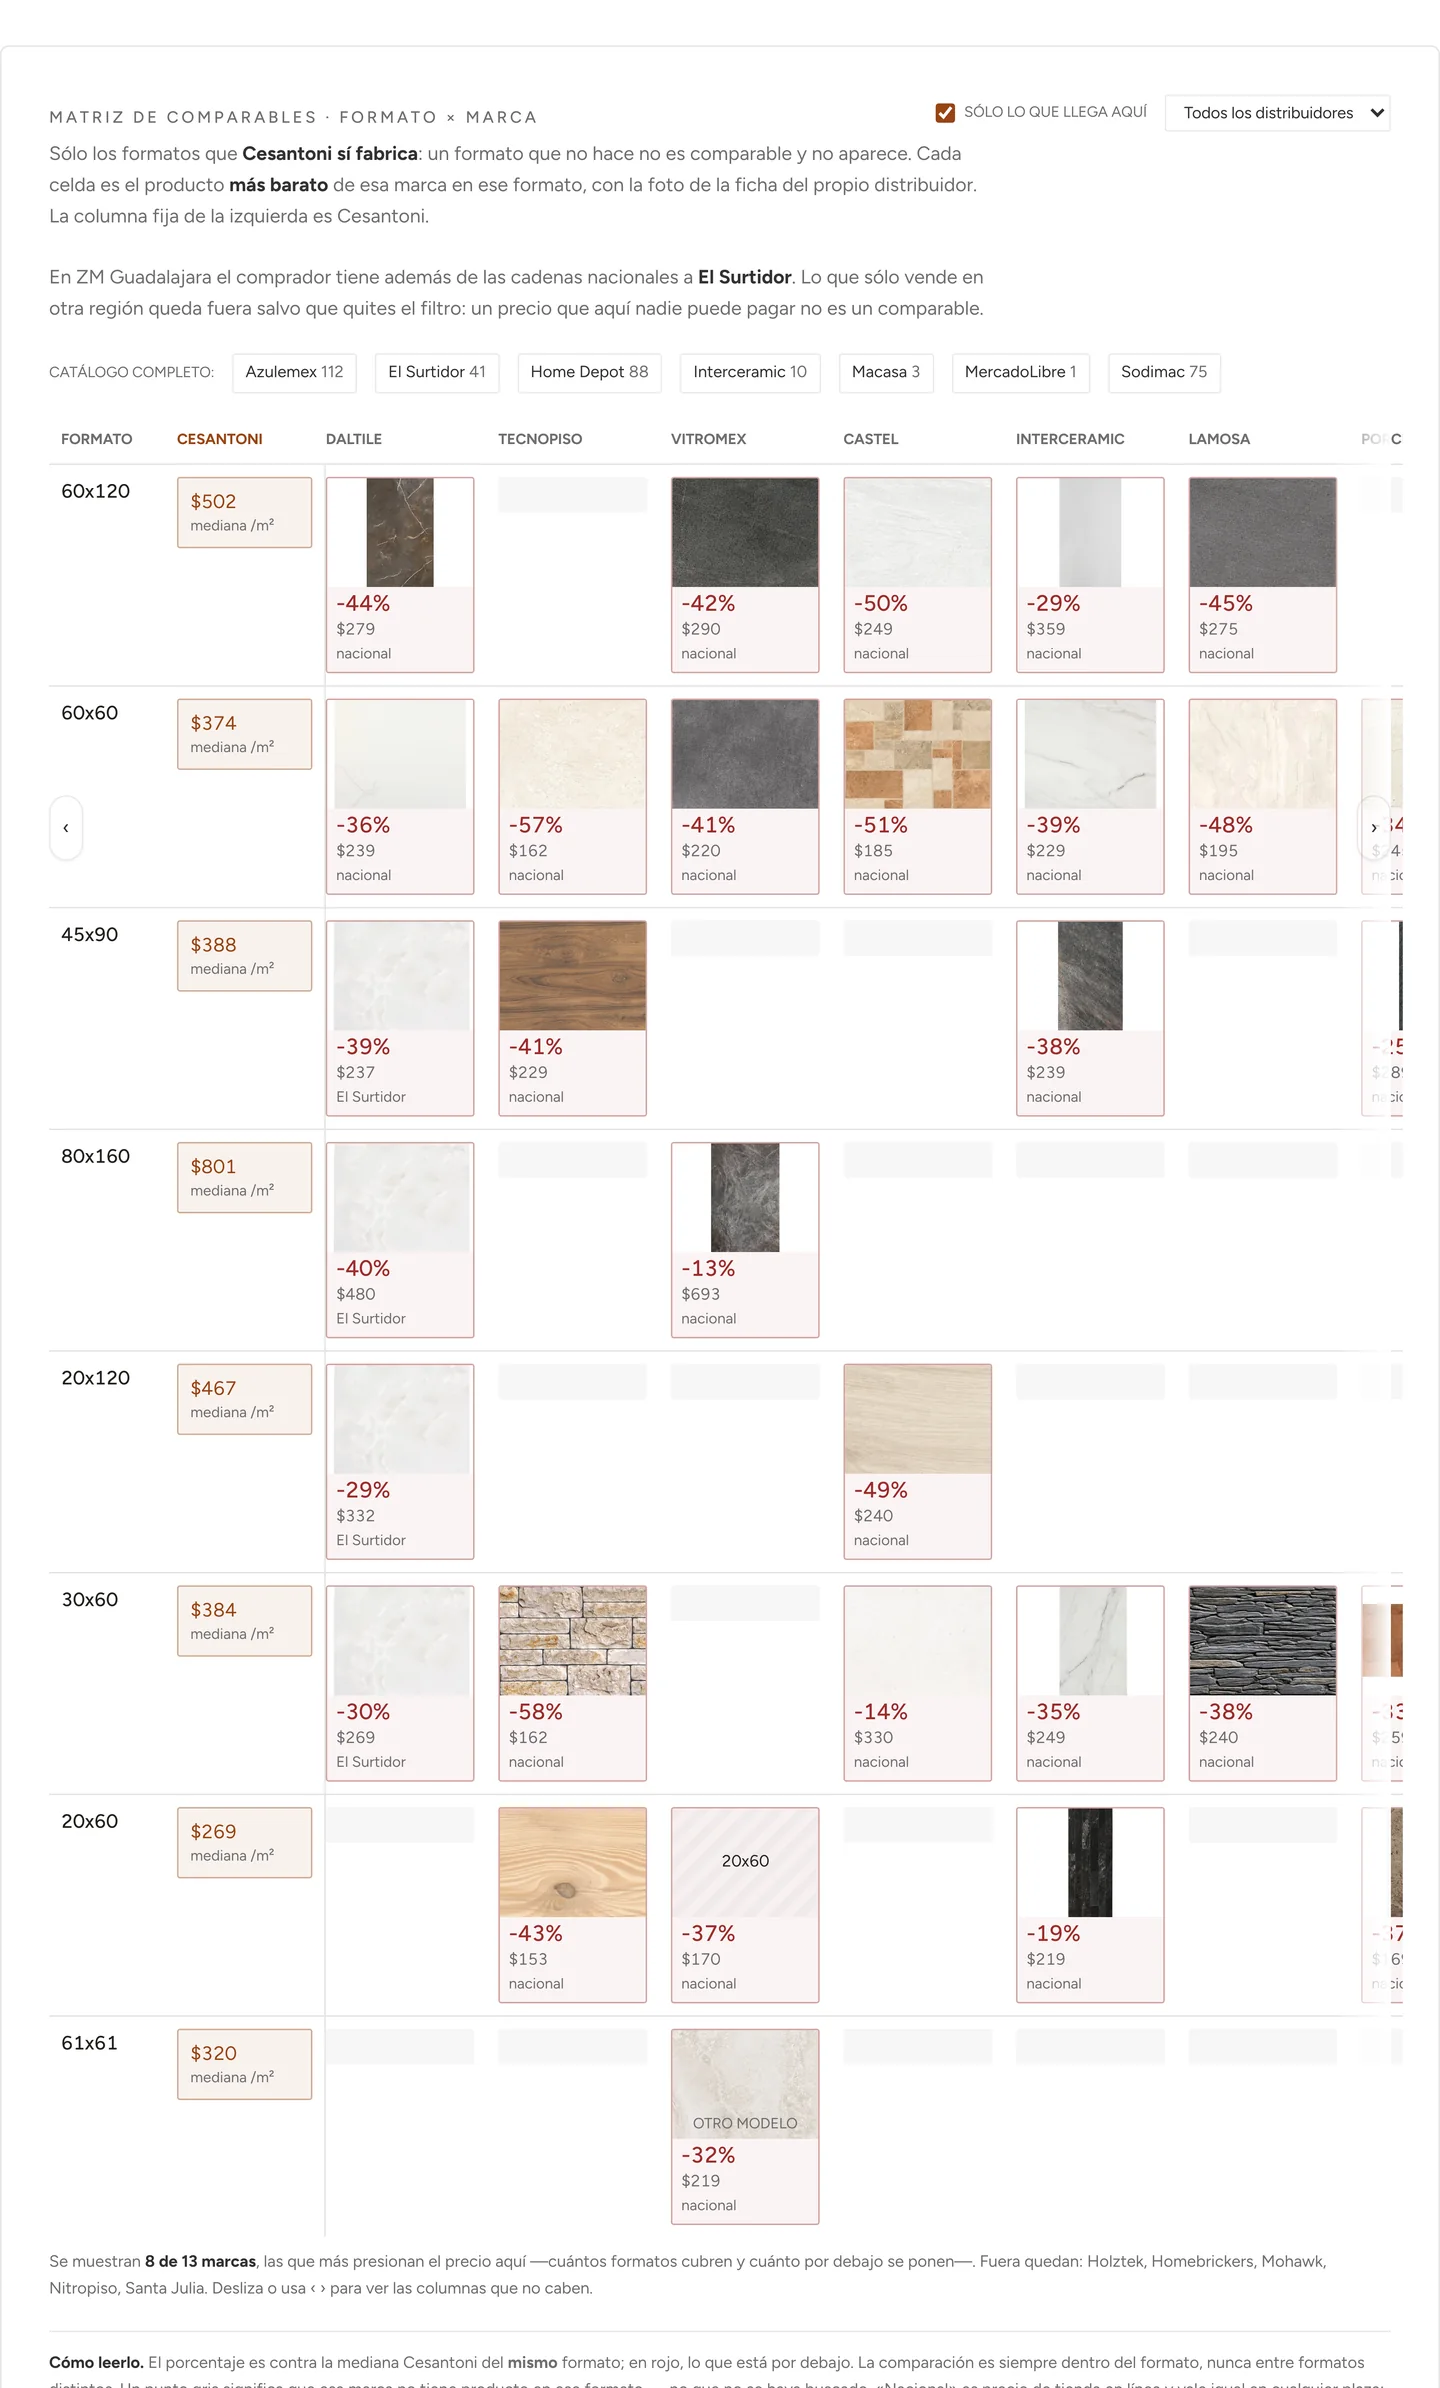
CThis is exactly what he asked for: the products, with their photo and their price.
Eight formats against eight brands. Each cell is the cheapest product from that
brand in that format, with the photo from the distributor's own listing, its price
per square meter and its difference against the house's median. Only the formats
Cesantoni actually makes show up — a format it doesn't make isn't comparable. And the
"only what reaches here" filter removes prices from other regions: a price nobody
in this market can pay isn't a comparable. The 60×120 row says it all: the house at
$502 and six brands between 29% and 50% below. Photos and prices from September 10, 2026.
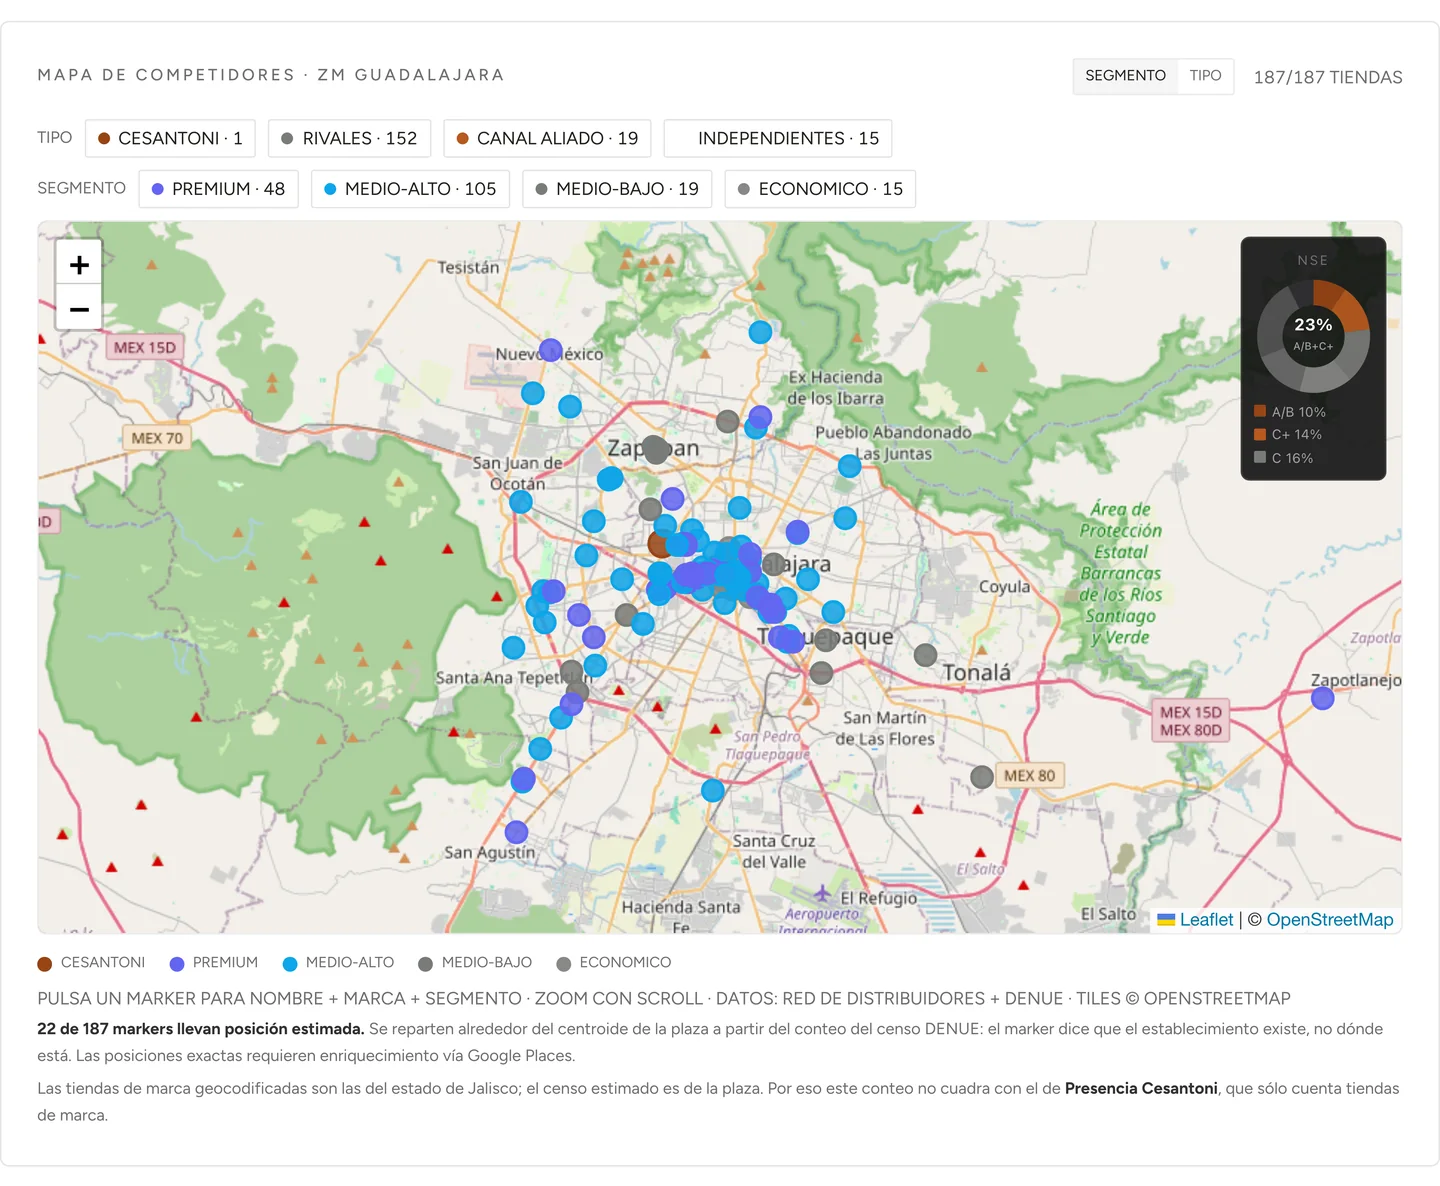
DWhere every competitor is, and whose pocket it lives off.187 stores placed
on the map one by one: 1 is the house's own, 152 are rivals, 19 allied channel and 15
independent. The color isn't decorative, it's the point-of-sale segment:
premium 48, mid-high 105, mid-low 19, economy 15. Top right, the
market's socioeconomic level: 23% of households are A/B or C+ (A/B 10%, C+ 14%,
C 16%). And at the bottom, written by the dashboard itself: "22 of 187 markers carry an
estimated position… the marker says the establishment exists, not where it is."
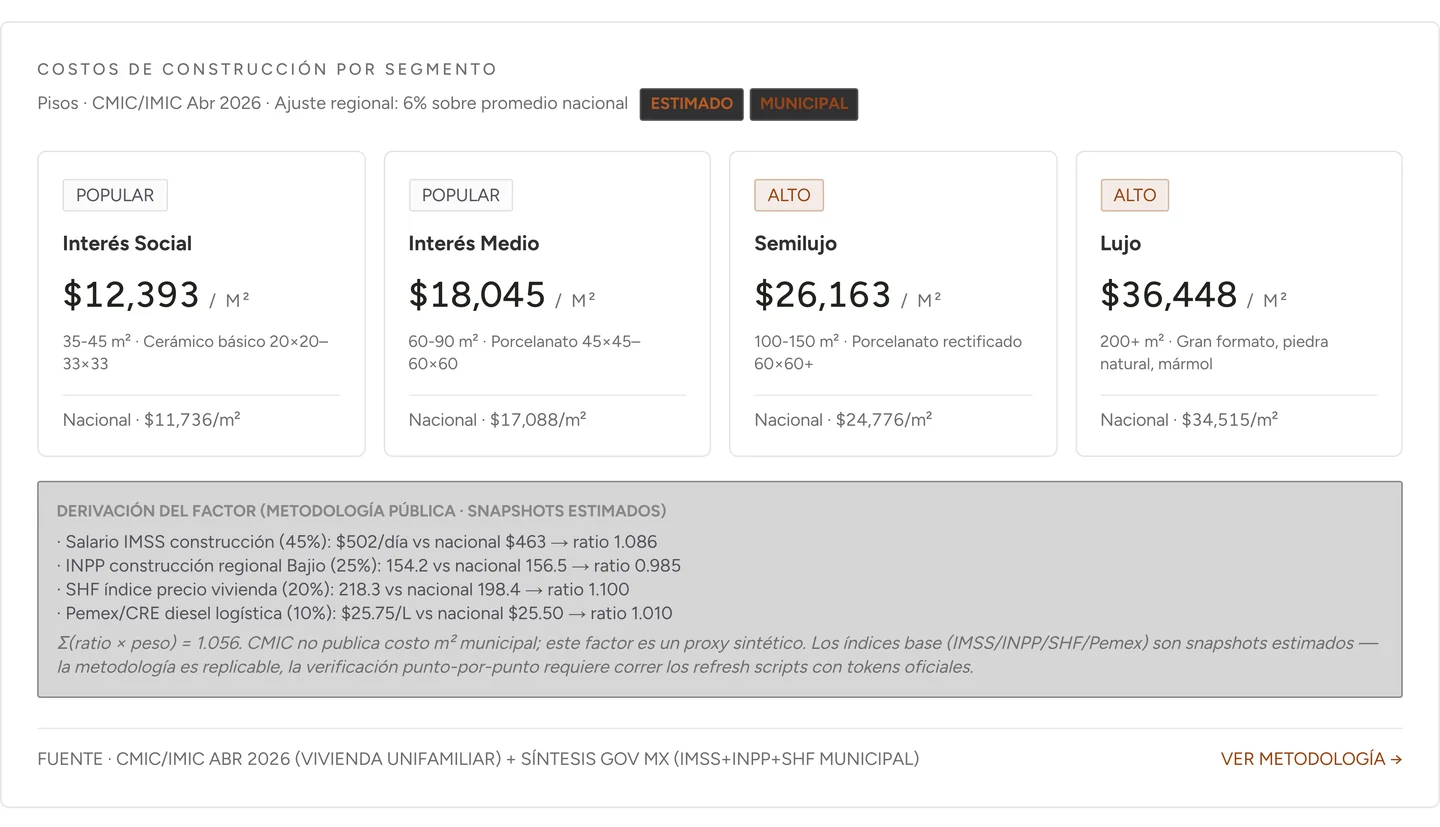
EThe economic segment, with its price and the product that matches it. Four
construction tiers in this market: social housing $12,393/m² (35-45 m², basic
ceramic 20×20 to 33×33), mid-income $18,045 (porcelain tile 45×45 to 60×60),
semi-luxury $26,163 (rectified porcelain tile 60×60+) and luxury $36,448 (large
format, natural stone, marble). Each against its national figure. And below, in gray, the
regional-factor derivation row by row: construction wage $502/day against $463
national, housing price index 218.3 against 198.4 — with the warning that it's a synthetic
proxy because the agency doesn't publish municipal cost figures.
This is how you decide which product goes to which market, and at what price.
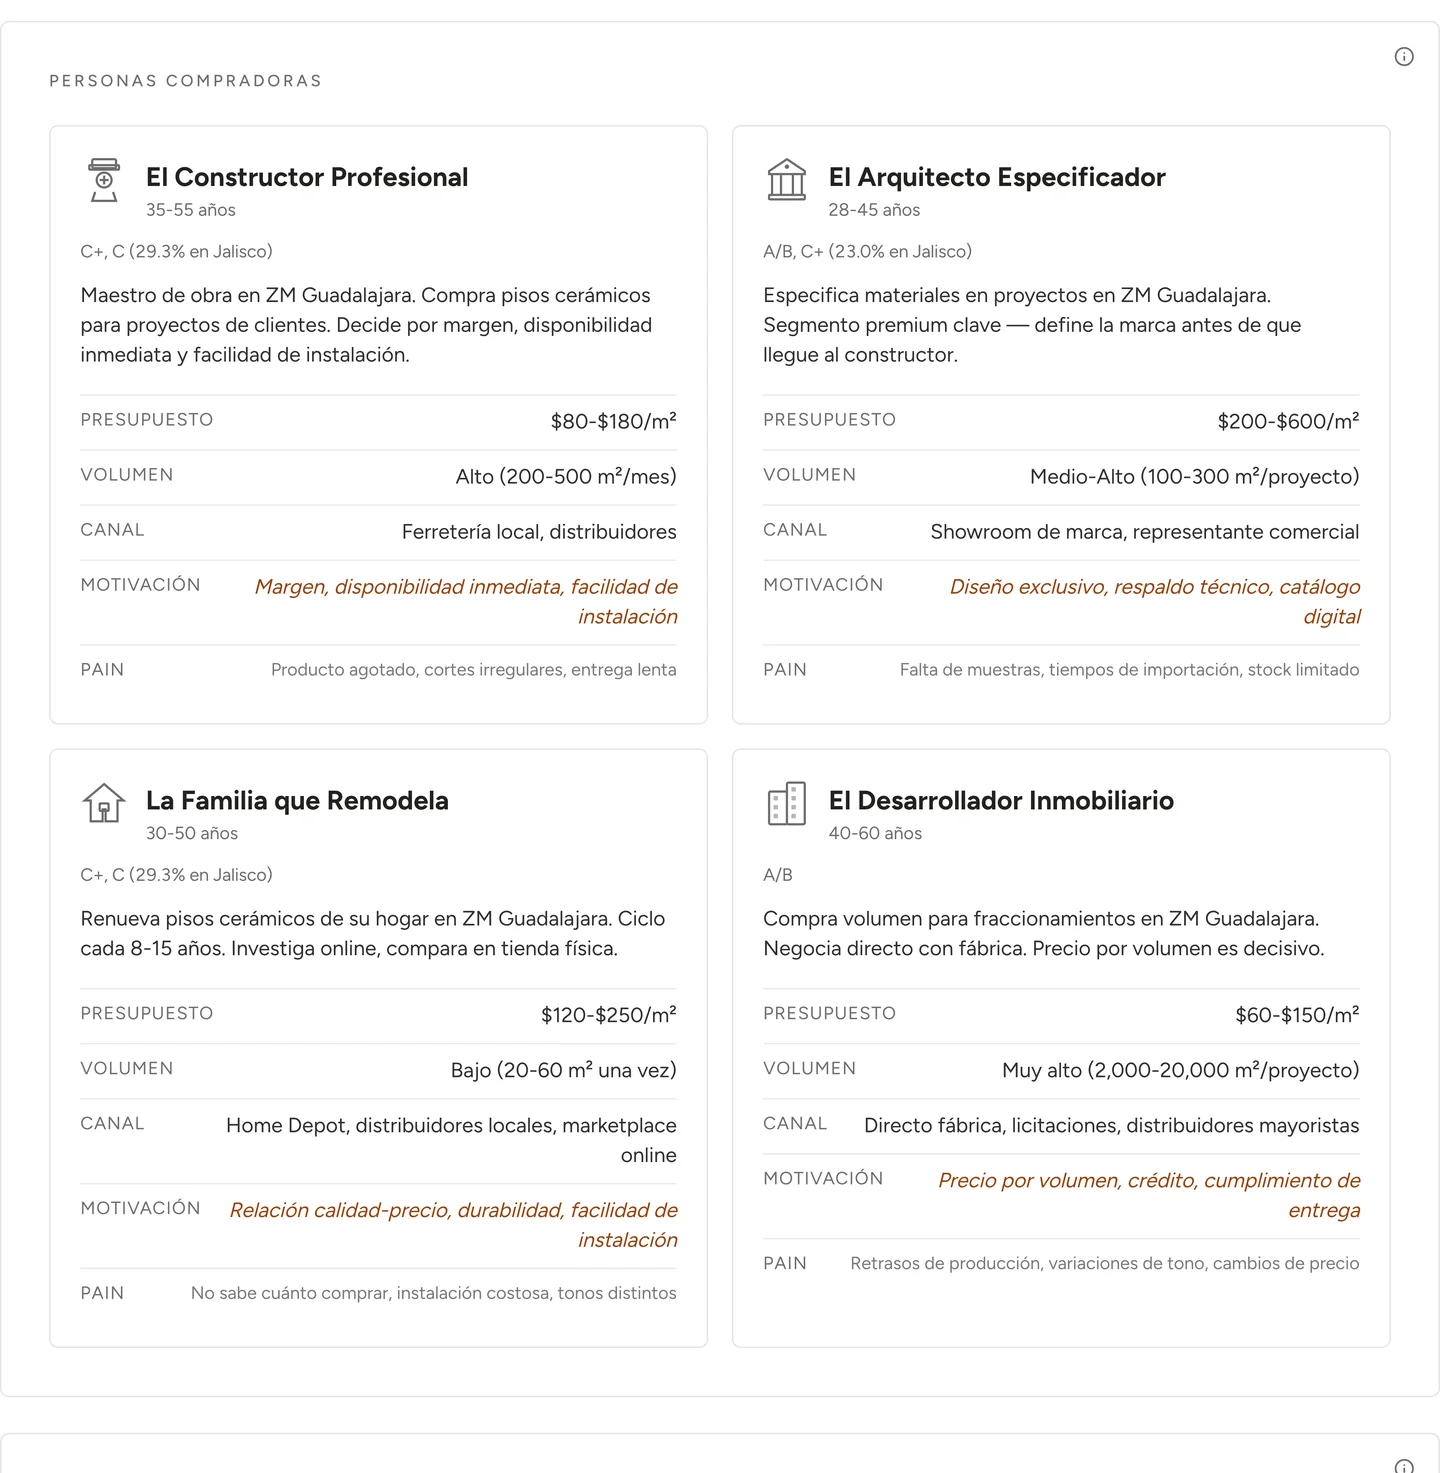
FAnd who signs off on the purchase. Four different buyers in the same market,
each with their socioeconomic level, their budget per square meter, and their
channel: the construction foreman (C+/C, 29.3% of Jalisco, $80-180/m², hardware store
and distributor, decides on margin and availability), the architect who specifies (A/B and
C+, 23.0%, $200-600/m², showroom, decides on design and backing), the family remodeling
($120-250/m², every 8 to 15 years), and the developer (A/B, $60-150/m² but 2,000 to
20,000 m² per project, straight from the factory). The richest one pays less per
square meter and buys a hundred times more. Each profile also carries the pain point
that makes them switch brands.
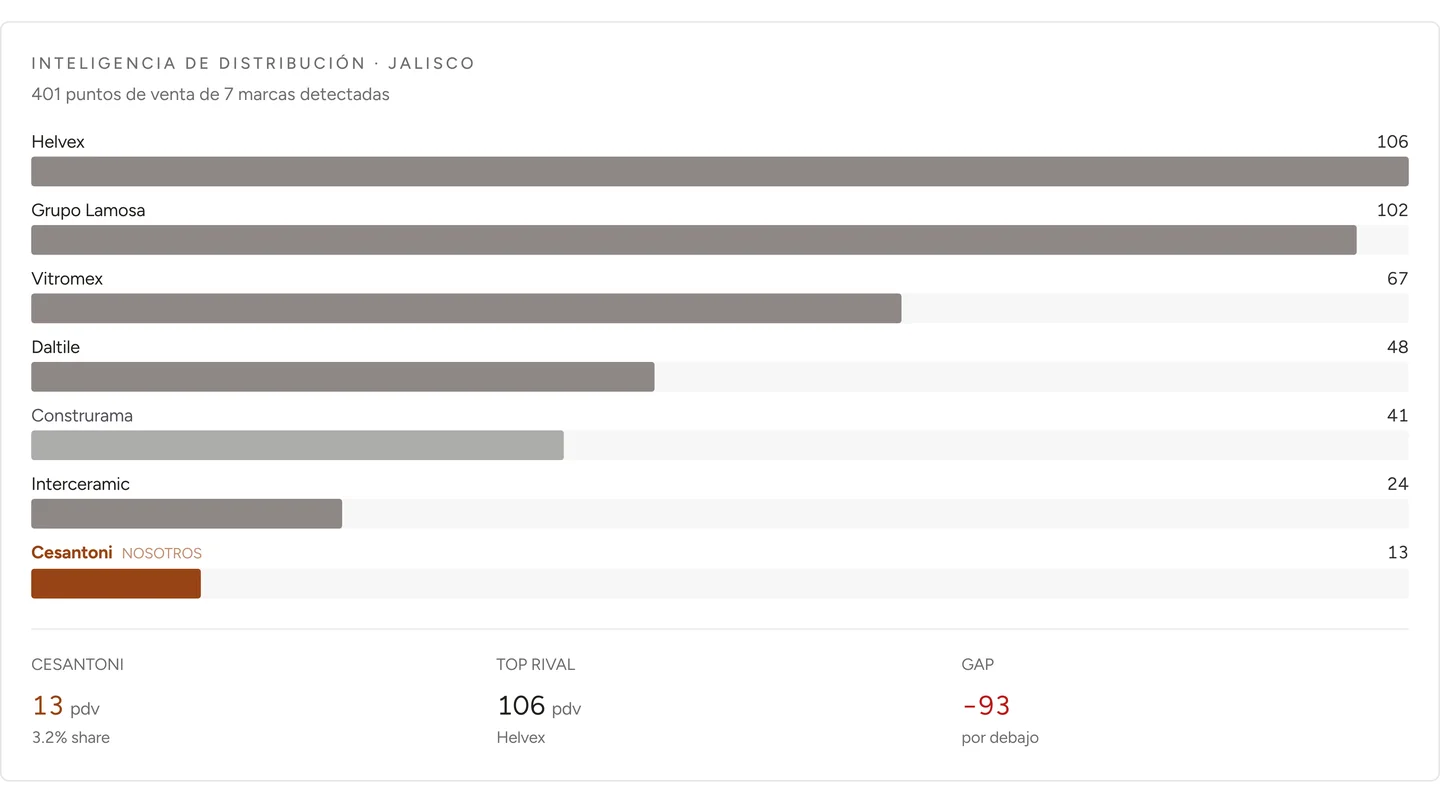
GWhere your brand is, and where it isn't.401 points of sale across seven
brands detected in the state. The leader has 106; the runner-up, 102. The house has 13 —
3.2% of the network, a 93-point gap against the leader. It isn't an opinion about
distribution: it's the count. That's exactly the dashboard a beverage company needs to know
which cities its brand is on the shelf in, and in which ones the competition is
alone.
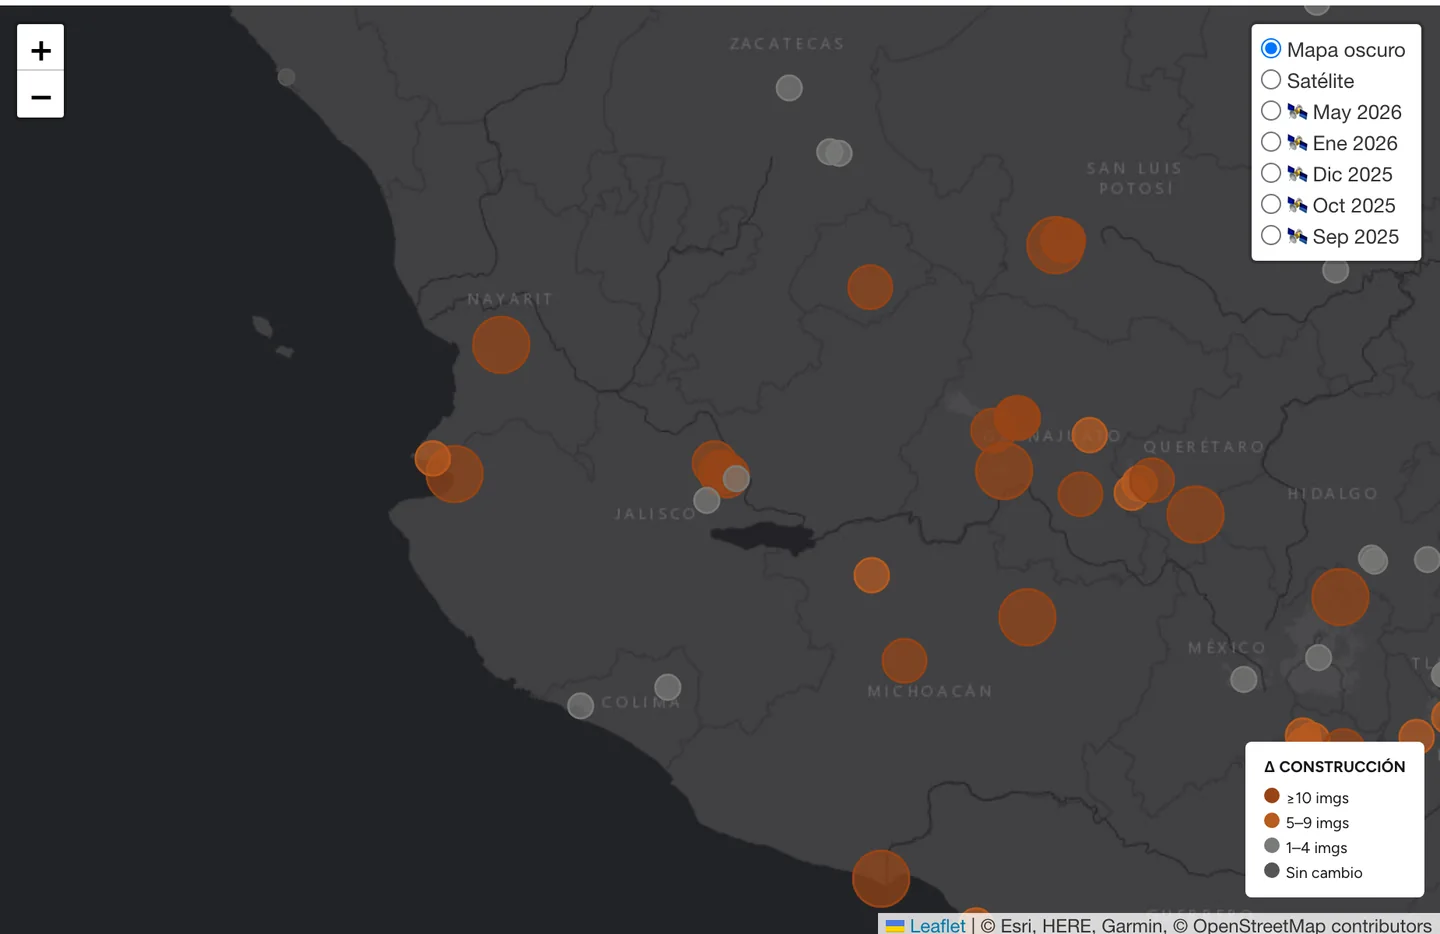
HAnd yes: satellite imagery, dated. The layer selector doesn't carry one
satellite view, it carries six: the current view and five dated passes
—September, October and December 2025, January and May 2026. The circle measures
how many images changed in that market between one pass and the next: strong
orange, ten or more; gray, one to four; dim, no change. It's the cheapest way there is to
see where construction appeared that wasn't there before — before the distributor
finds out.
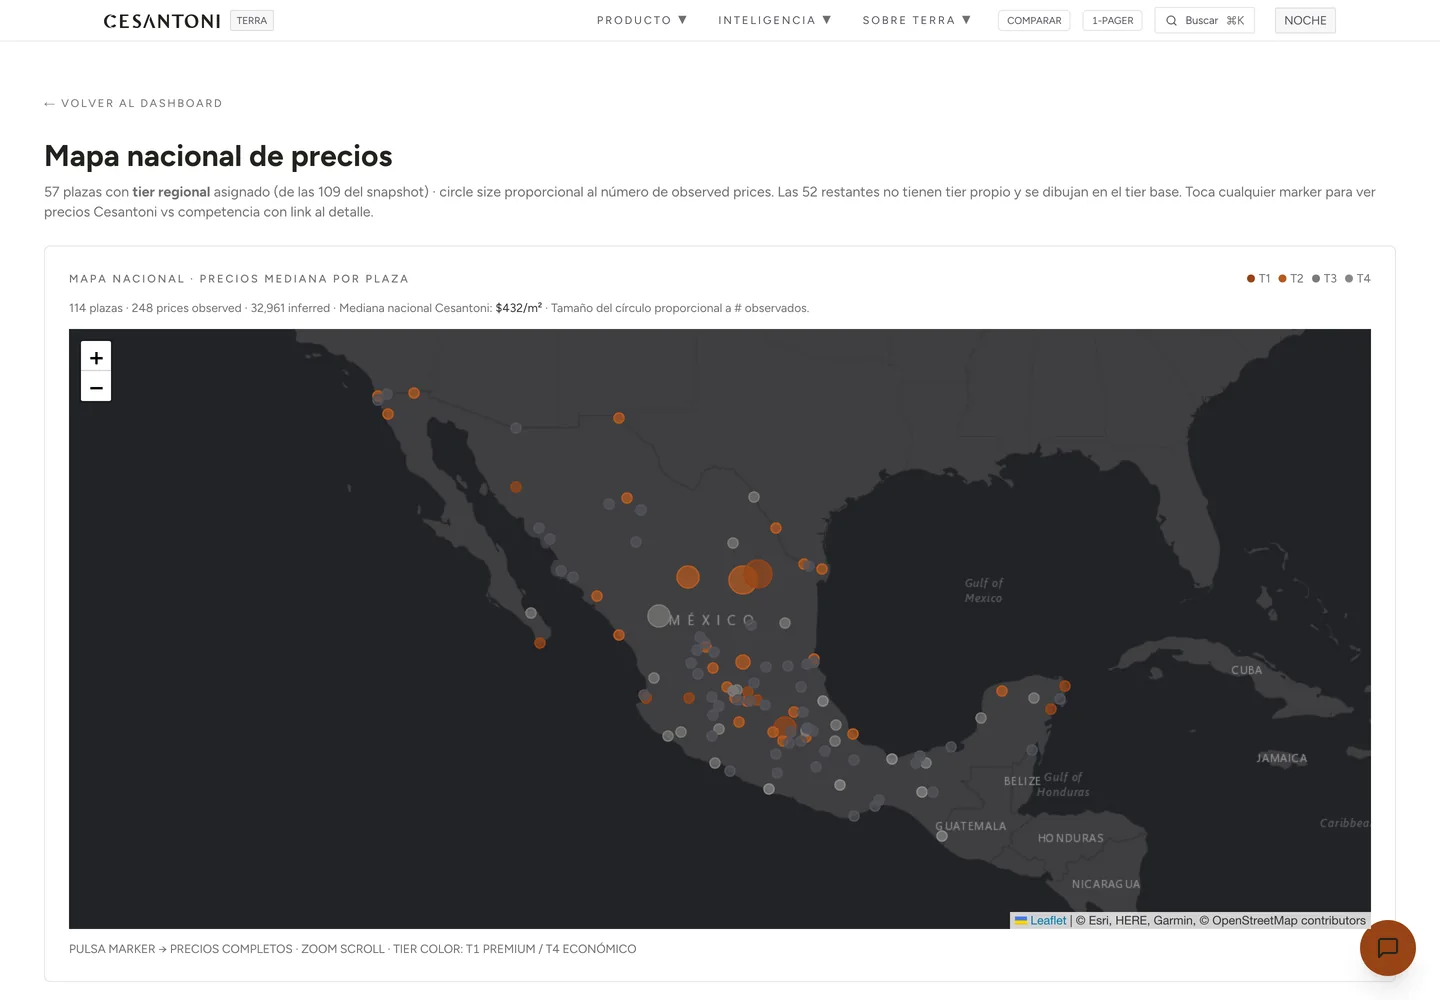
IThe whole country, by price level.248 observed prices and 32,961
inferred, the brand's national median at $432/m². The circle's size is
how many real prices are there —not decoration: where the circle is small, the figure is
weak and it shows. The color is the regional level: premium +18%, mid-high +8%, base and
economy −12%. 57 of the 109 markets have their own level; the other 52 are
drawn at the base, and the map says so.
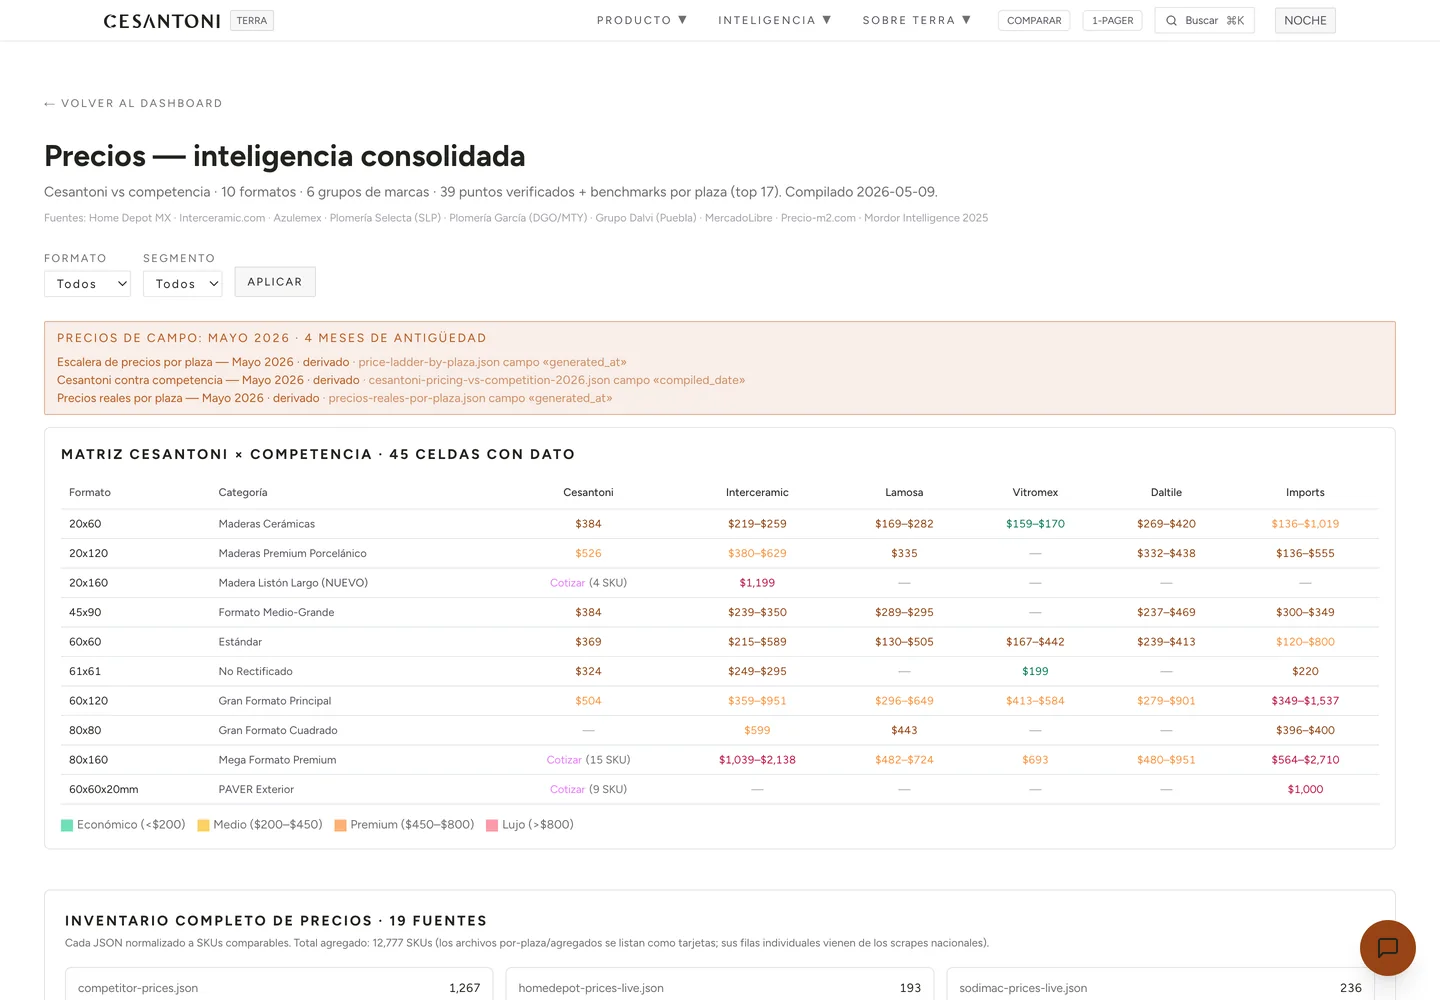
JThe national matrix, and its expiration date. Ten formats against six
brand groups, 45 cells with data, 39 points verified by hand. At the top, in orange
and before any figure: "field prices: May 2026 · 4 months old", with
the exact file and field that date comes from. Below, the inventory: 19 sources,
12,777 SKUs, each with the day it was harvested.
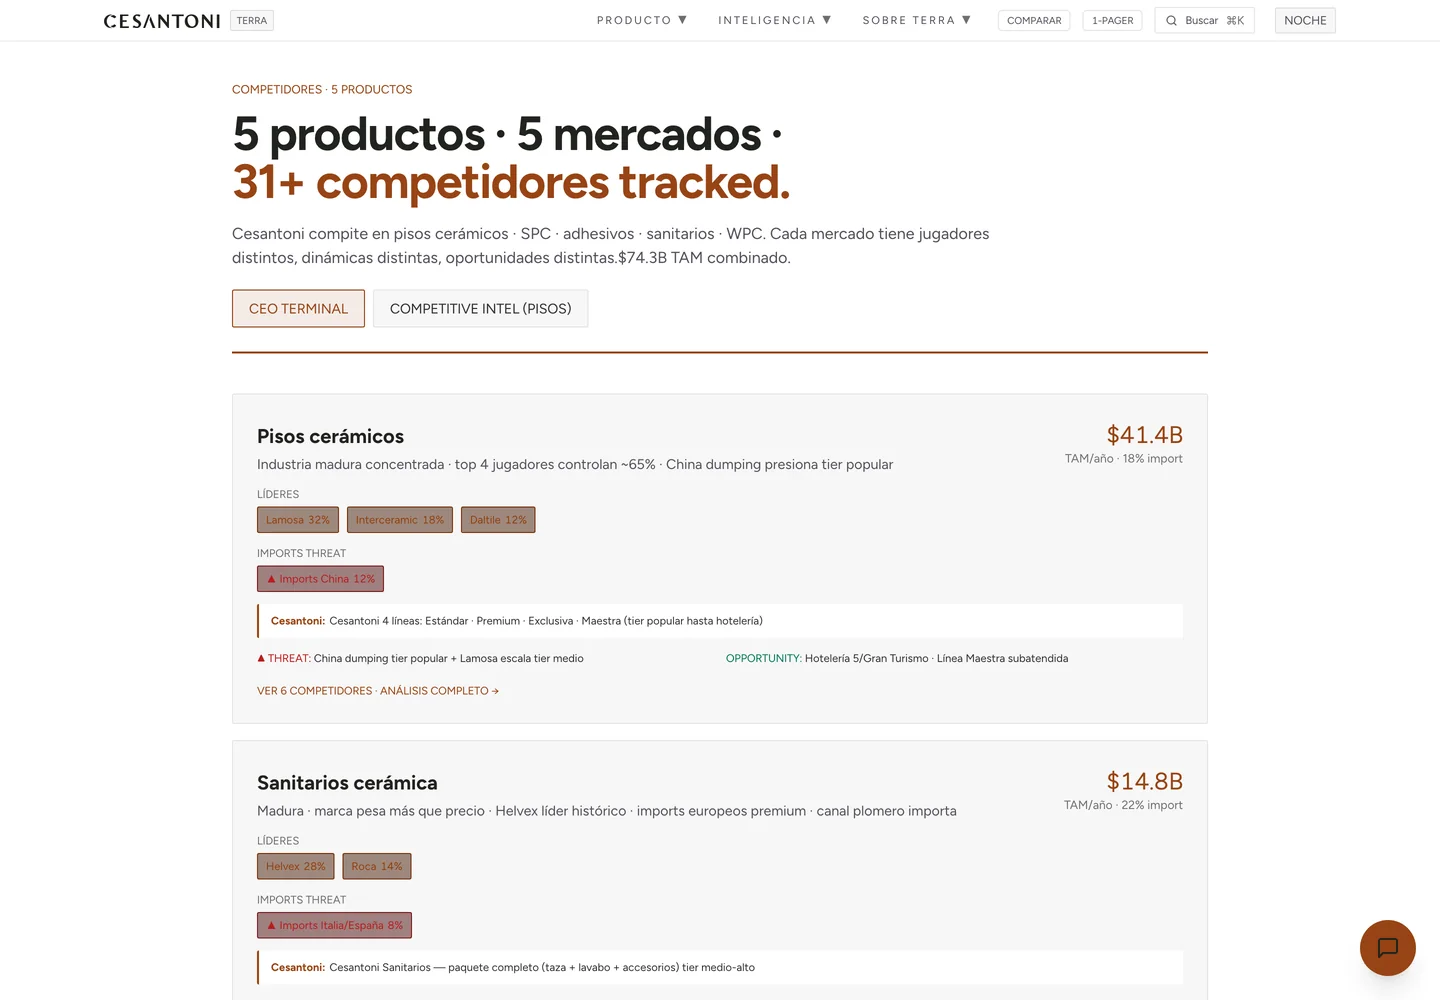
KFive markets, not one.31+ competitors tracked over USD 74.3 B
of combined market. Ceramic floor tile: USD 41.4 B, 18% imported, the leaders with their
participation (32%, 18%, 12%) and the threat named —Chinese imports at 12% of the
market, pressuring the entry tier. Every market carries its threat and its opportunity
written in one line, not in an appendix.
109markets covered, across 32 states
67.2 Mpeople within coverage
12,777price SKUs, from 19 sources with their date
187competitor stores located in a single market
4construction tiers, with their price and their product
5categories measured in every market
The finding that pays for the dashboard: your own price
Channel audit · 366 SKUs with public pricing · 14 distributors
Terra wasn't built to spy on the
competition. The finding that moved the most money was about the house's own
product: the same SKU, the same month, and a different price depending on who
sells it.
Stoneware tile · entry line$332.56 at one distributor · $542.08 at another
+63%
Large format · bone$499 against $801.43
+60.6%
Large format · gray$499 against $801.43
+60.6%
Ceramic tile · mid line$241.23 against $366.17
+51.8%
29 products show up in two or more stores
out of the 366 with public pricing, spread across 14 distributors. None of those
differences was authorized, and none was visible from the office: they only show up
when someone harvests every distributor's listing and lines them up in the same row.
It's the same bottle, in two bars in the same city, at two prices you never set.
And the dashboard accuses itself
TAM reconciliation · three independent estimators
There's a page in the product whose only job is
to run three different estimators against the same market and show where they
disagree. It isn't a hidden technical appendix: it's right there in the menu.
The three estimators, on the same market
Bottom-upUSD 18.1 thousand M — households × renovation × ticket
Top-downUSD 41.4 thousand M — household share of the national total
Napkin mathUSD 14.1 thousand M — households × flat spend
And what the page itself concludes
194.6% spreadmedian across the three
"Expected divergence"they measure different concepts, it isn't an error
None of them is officialthe canonical one is a different one, and it says which
The dashboard itself marks the rangeand the figure reads as order of magnitude
A dashboard that shows a single big number is
easy to sell and hard to defend. This one shows three, says which one to cite to a
client, and writes the row an auditor would look for: where each one comes from,
as of what date, and when it changed.
What Terra proves
Terra proves the method: that we know how to build a country's census, maintain
it, and declare its age. Cesantoni's dashboard lives behind a locked door —it's a client's
account—, so the screens above are screenshots of the live product.
And where the model doesn't line up, the dashboard flags it on its own: that
figure reads as order of magnitude and it says so on the screen, not in an appendix. The
score ranks markets against each other with its thirteen published components,
traceable one by one.
And if you already have something ready
Send me the campaign you're about to pay for.
Before the market tells you whether it worked —once it's already charged you
for the mistake— we tell you. And if we have no way to measure your category, we tell you
that too, no quote required.